VERTICALSERVE
Executive Whitepaper · 2026
An executive perspective on business intelligence
AI-Native
Business Intelligence
From dashboards to reasoning: how enterprises are moving from charts people read to explanations people can follow — grounded in their own rows, bounded by their own definitions, and safe to act on.
For CIOs, CFOs, heads of data and the managers who own the numbers — the people paying for a BI estate that answers what and never why, who are being asked to put AI on top of it and need a version that survives a board meeting, an audit and a sceptical finance director.
Executive Summary
A dashboard answers "what". The meeting asks "why".
Every business intelligence tool in the market can show a manager that sales fell in August. Not one of them tells her why. That question — which region, which product, which customers, since when, and is this unusual — leaves the dashboard the moment it is asked. It goes to an analyst, becomes a ticket, comes back on Thursday, and the decision was made on Tuesday without it.
Time where a management team's analytical hours actually go and the shape is consistent: a small share reading numbers, a larger share reconciling them (two teams, two revenue figures, one meeting), and the largest share asking — the follow-up questions no dashboard was built for. The reading is what the estate was bought for. The reconciling and the asking are what it costs.
Most organisations are responding by adding a chat box to their BI tool. The leading ones are discovering that the transformation is not about the chat box. It is about whether the answer can be followed — whether a finance director can see where each figure came from, whether a cause was found in the data or made up to fill the sentence, and whether the answer respected who was asking.
The old question
"How do we build dashboards people actually use?"
The new question
"Why is a person still working out the why?"
AI-native business intelligence in one sentence
One governed vocabulary that every chart, exploration and AI answer draws on; a chart that explains itself — the drivers of any change worked out from the rows rather than guessed; a conversation bounded by that evidence, which says so when the rows cannot answer; and every figure checked against the data before a person sees it.
Reasoning, not rendering
The two periods, the contribution of every dimension, the trend and the next step · computed in under a second, on the chart
Definitions as a contract
Metrics and access rules held as data · the AI picks from the catalogue, a compiler writes the SQL, the rules ride inside it
Grounded answers
Every figure in every sentence traced to a cell · an invented number is dropped, not shown
The remainder of this paper sets out why the dashboard model is under pressure, what actually happens when a manager asks why, which parts of that work belong to software and which to people, the operating model and reference architecture that follow, and the sequence a leadership team should use to adopt it.
1 · The Dashboard Model Is Under Pressure
For twenty years business intelligence has meant dashboards, and for good reason. A dashboard is a decision someone made once — which numbers matter, at what grain, next to which others — that hundreds of people can then consume without making it again. The economics are sound. Nobody has invented a better way to put the same twelve numbers in front of a thousand people every Monday.
What has changed is what those thousand people do next. They no longer stop at the number. They ask about it — in the meeting, in the channel, in the reply to the email the dashboard was attached to — and the dashboard model has no answer to a question it was not built for except to build another dashboard. Estates grow to hundreds of workbooks this way, each one a question somebody asked once, and most of them never opened again.
What the estate says about itself
Organisations that audit their own BI usage find the same pattern: between half and four fifths of dashboards were not opened by anyone in the last ninety days, the majority of licensed users only read and filter, and the same headline metric exists under three or more definitions across finance, commercial and operations. Tableau and Power BI usage exports, licence reports, and — more usefully — whatever your own estate says. The measurement is in section 7.
Three costs the licence bill does not show
The viewer tax. Most of a BI licence bill is people who open a dashboard, change a filter and read a number. They generate no content and are priced like authors, so organisations ration access — and the people who need the number most are the ones without a seat.
Metric drift. A definition that lives inside a file drifts one workbook at a time. Two teams bring two revenue figures to the same meeting; nobody did anything wrong. The first twenty minutes of the meeting go to reconciling, and the reconciliation is not written down, so it happens again next month.
The Thursday answer. The question that matters is asked on Tuesday, in the room. The analyst who can answer it is a queue. By Thursday the answer is correct, well-formatted, and irrelevant — the decision was made with what was on the screen.
Every dashboard looks healthy. It loads, it is accurate, it is on time. The cost is in the questions it cannot take — and those belong to no dashboard, so nobody measures them.
There is a quieter effect. Because the dashboard cannot answer why, managers stop asking it. They learn which questions the tool can take and confine themselves to those. The estate looks well used; the decisions are being made on a fraction of what the data could say.
2 · Anatomy of a Question
Averages hide the shape. Below is one question, timed end to end: a regional director opens the Monday sales dashboard at 09:05, sees that sales fell in August, and wants to know why before the 11:00 leadership call. The organisation has a competent analyst, a governed warehouse and a dashboard that is accurate. It is a well-run estate. This is what happens in it.
| Elapsed | What happened | Produced |
|---|
| 09:05 | Opens the dashboard. Sales fell. Filters by region: all three are down. Filters by category: all three are down. Nothing on the page says which one matters. | A symptom |
| 09:12 | Messages the analyst: "Why is August down? Need it for 11." The analyst is in a stand-up. | A ticket |
| 09:40 | The analyst opens the warehouse, writes a query for sales by region by month, then by category, then by segment. Exports to a spreadsheet. Builds the deltas by hand. | Six queries |
| 10:20 | Finds that the high-value order band carried most of the fall, and technology within it. Checks whether August is seasonal: pulls twenty months. It is the lowest. | A finding |
| 10:50 | Pastes four bullets and a chart into the channel. The director reads them walking into the call. | An answer |
| 11:05 | On the call: "Is that fewer orders or smaller ones?" Nobody knows. The point is deferred to next week. | A deferral |
Sorted by what each minute was for, rather than when it happened, the shape is stark. Roughly ninety minutes of a skilled analyst's morning went into work with a correct answer that does not depend on who performs it: the same six grouped queries, the same deltas, the same ranking, the same twenty-month comparison. Perhaps ten minutes were judgement — deciding that the order band was the story rather than the region — and the one question that needed a person was never reached at all.
Assembly — most of the morning
Mechanical, and repeated identically for every "why". The same figure by every dimension in two periods. The contribution of each member. Which one moved the other way. Where the period sits in the series. Six queries with correct answers that do not depend on who asks.
Judgement — ten minutes, plus the one that was missed
Consequential, and requiring accountability. Deciding what the finding means for the quarter, and what to do about the accounts in the high band. This is why you employ a regional director — and it is what the morning's assembly crowded out.
The four bullets in the channel record none of the working. When the same question is asked about September a different manager waits for a different analyst to run the same six queries. Not through carelessness: writing the working down in a message at 10:50 is not a reasonable thing to ask of someone with a call at 11:00.
3 · What AI Should Do, and What It Should Not
There are two failure modes in AI-for-BI programmes and they are mirror images. Doing too little produces a chat box that rephrases the dashboard. Doing too much produces a system that writes its own SQL against the raw warehouse, invents a join, and presents a confident number nobody can trace. Both come from skipping the same step: separating the mechanical from the consequential.
| The demand | Its character | What follows |
|---|
Gather
What moved, by how much, in which parts? | Deterministic. Same rows, same answer. Arithmetic over grouped queries. | Automate without a model in the loop. This is where the morning went. |
Interpret
What does that mean, in words? | Probabilistic. A model writes well and invents easily. | Let a model write — and check every figure it wrote against the rows before anyone reads it. |
Decide
What should we do? | Consequential. Needs context the data does not hold. | Offer the next step — filter, drill, watch — and leave the decision with a person who can be asked why. |
The failure mode that ends pilots
A chat assistant is asked why sales fell. It answers: "Sales fell 32% in August, likely due to seasonal factors and reduced demand in the Technology category." Half of that sentence is a number the model read from a query. The other half is a cause it produced because the question asked for one and the rows did not contain it. Nothing in the sentence says which half is which.
The damage is not the wrong answer — managers are used to reports being wrong. The damage is that the cause was fabricated and presented in the same voice as the fact. Once a finance director catches a system doing that, they stop reading its output permanently, and they say so in the meeting. Trust in this category is spent once. The question that matters is therefore not how often the assistant is right, but how it behaves when the data cannot answer — and whether it knows.
What a defensible answer looks like
Not a confidence score. Three properties, each of which you can test on your own data before signing anything.
Figures trace to rows
"High accounts for 54% of the decline (−$2,817, from $9,051 to $6,234)" — each number a cell, or a ratio of two cells, marked as such
Causes come only from data
"Because of two lost accounts" can be said if the rows show it · "because of the weather" cannot be said at all
Gaps are stated
"The panel does not carry order counts; one further query would answer whether it was fewer orders or smaller ones" — worth more than any score
A corollary vendors rarely volunteer: for most of this work, arithmetic beats a model. The contribution of a region to a change is a subtraction; the share is a division; the ranking is a sort. Anything a finance director will question is better served by a deterministic procedure you can point at than by inference you cannot. A system that needs a model to say what moved has put a probabilistic component where a calculator belongs. The model's job is the prose — and the prose is checked.
4 · The Vocabulary Has to Become a Contract
Every organisation has defined its metrics. The definitions are in the workbooks, and they disagree. This is not a discipline problem, and asking teams to "align on definitions" in a workshop will not fix it. A definition that lives inside a file cannot be shared; what cannot be shared is copied; what is copied drifts one edit at a time. The drift is structural.
Traditional
A calculation inside a workbook. Written by whoever built the dashboard, correct on the day. Copied into the next workbook with one filter changed. Eighteen months later there are five versions of net revenue and a meeting about which is right.
AI-native
A catalogue held as data. Dimensions and metrics with business names, descriptions and synonyms; row and column access rules attached to the data, not the file. Every dashboard, every exploration and every AI answer compiles from the same catalogue — so a metric means one thing everywhere, and changing it is one change.
The difference matters most for the AI. Text-to-SQL against raw tables fails on three things: the wrong join, the inconsistent metric, the invented column. A catalogue removes all three by construction. The model is never asked to write SQL. It is asked to pick dimensions, metrics and filters from the catalogue it was shown — a constrained choice, not free composition — and a deterministic compiler writes the SQL, with the reader's access rules inside it. The model cannot ask for a column it was not shown, so a column policy is enforced by the shape of the question; a row policy is applied in the compiler, invisible to the model and impossible for it to route around.
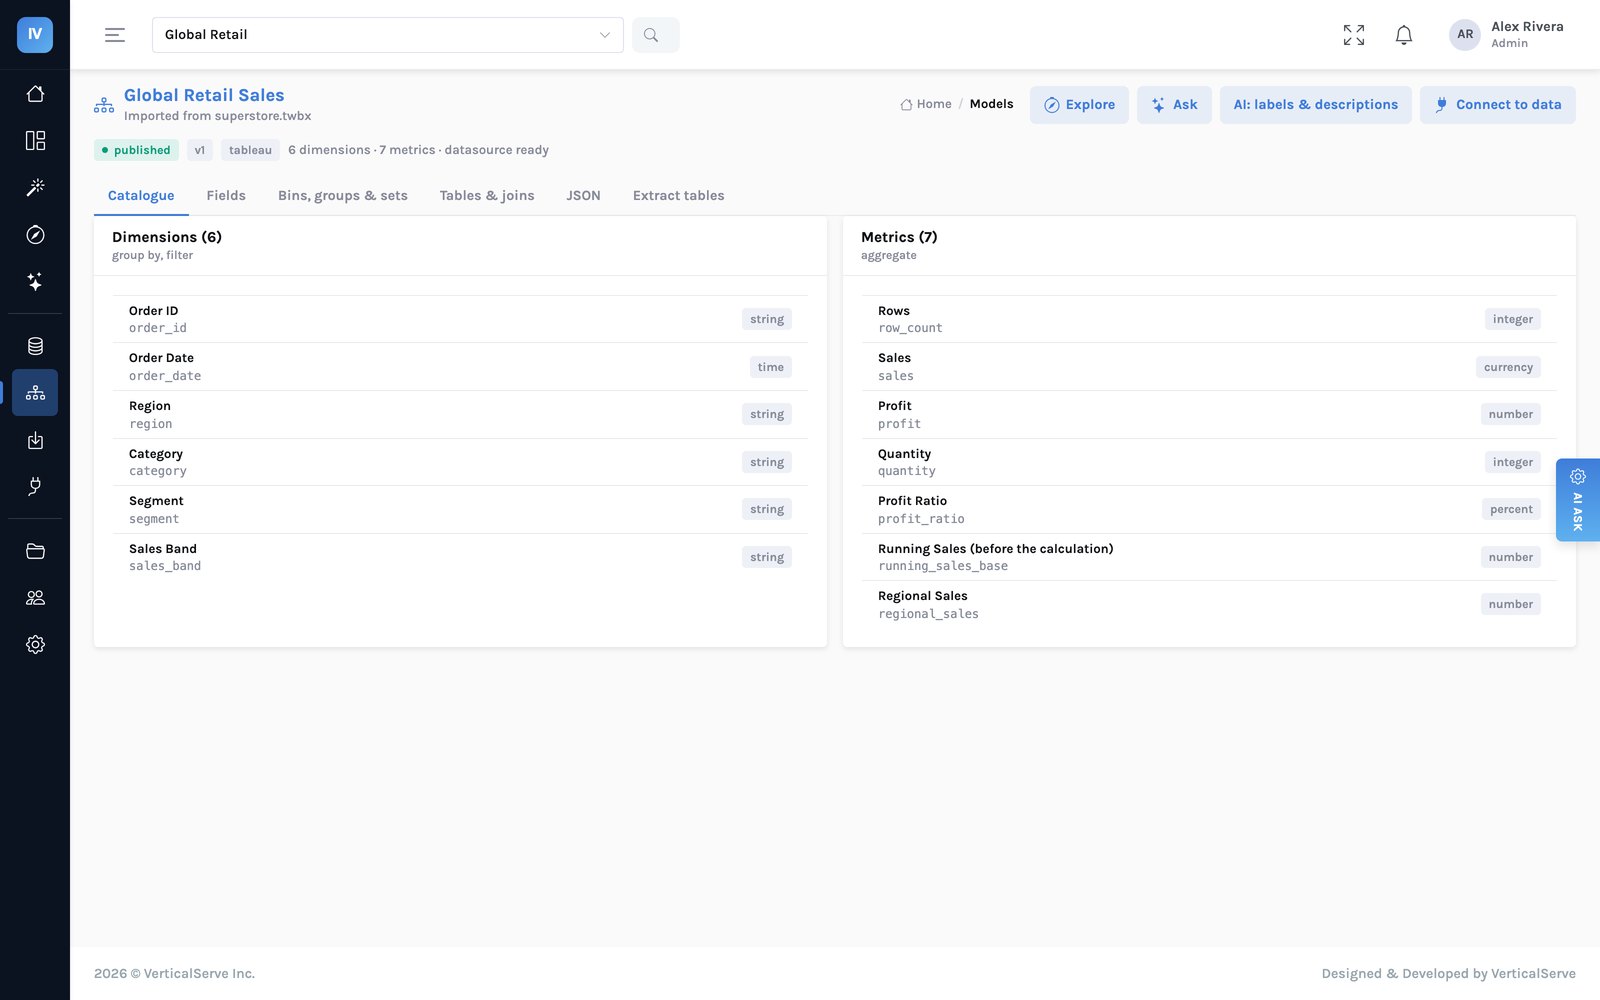
The catalogue as the AI and the people see it: business names, descriptions, synonyms — never raw SQL. The assistant picks from this list; the compiler does the rest.
The governance argument
This is where the operating-model case is stronger than the productivity case, and it is the part risk functions recognise immediately. A regional manager who may only see their region asks the assistant why sales fell. The answer must be an explanation of their region, computed from the rows they are allowed to see — not a company-wide answer with the other regions blanked out after the fact, and not a leak. When the rules are compiled into every query, there is no version of the answer that was ever computed on data the person could not see.
The transformation, stated plainly. Definitions and access rules move out of files and into a contract the organisation owns. Every question — a dashboard's, an analyst's, a manager's typed in plain words — is answered through that contract, and the answer carries the working. That is the property that lets an AI answer sit in front of a CFO: not that the model is good, but that it could not have said anything the data did not support and the reader was not allowed to see.
5 · Reasoning You Can Follow, Not a Chart You Can Read
The most common wrong answer to "why did this move?" is another chart. A breakdown by region invites a breakdown by product, which invites one by segment, and the manager is now doing the analyst's morning with a mouse. The answer to a why-question is not a picture. It is a chain: what moved, what carried it, what moved against it, where it sits in the trend, and what to do about it — each link a click away from the next.
Traditional
Drill until you find it. Filter, drill, cross-filter, export, compare in a spreadsheet. The tool supports the mechanics; the reasoning is entirely the person's. The path is not recorded, so nobody else can follow it.
AI-native
Press Why, then follow. The change is explained on the chart: the periods, the drivers ranked, the member that moved the other way, the trend. Each sentence is grounded; each driver is a click that narrows the page or explains itself in turn; the next step is offered — filter to it, break it down, watch it.
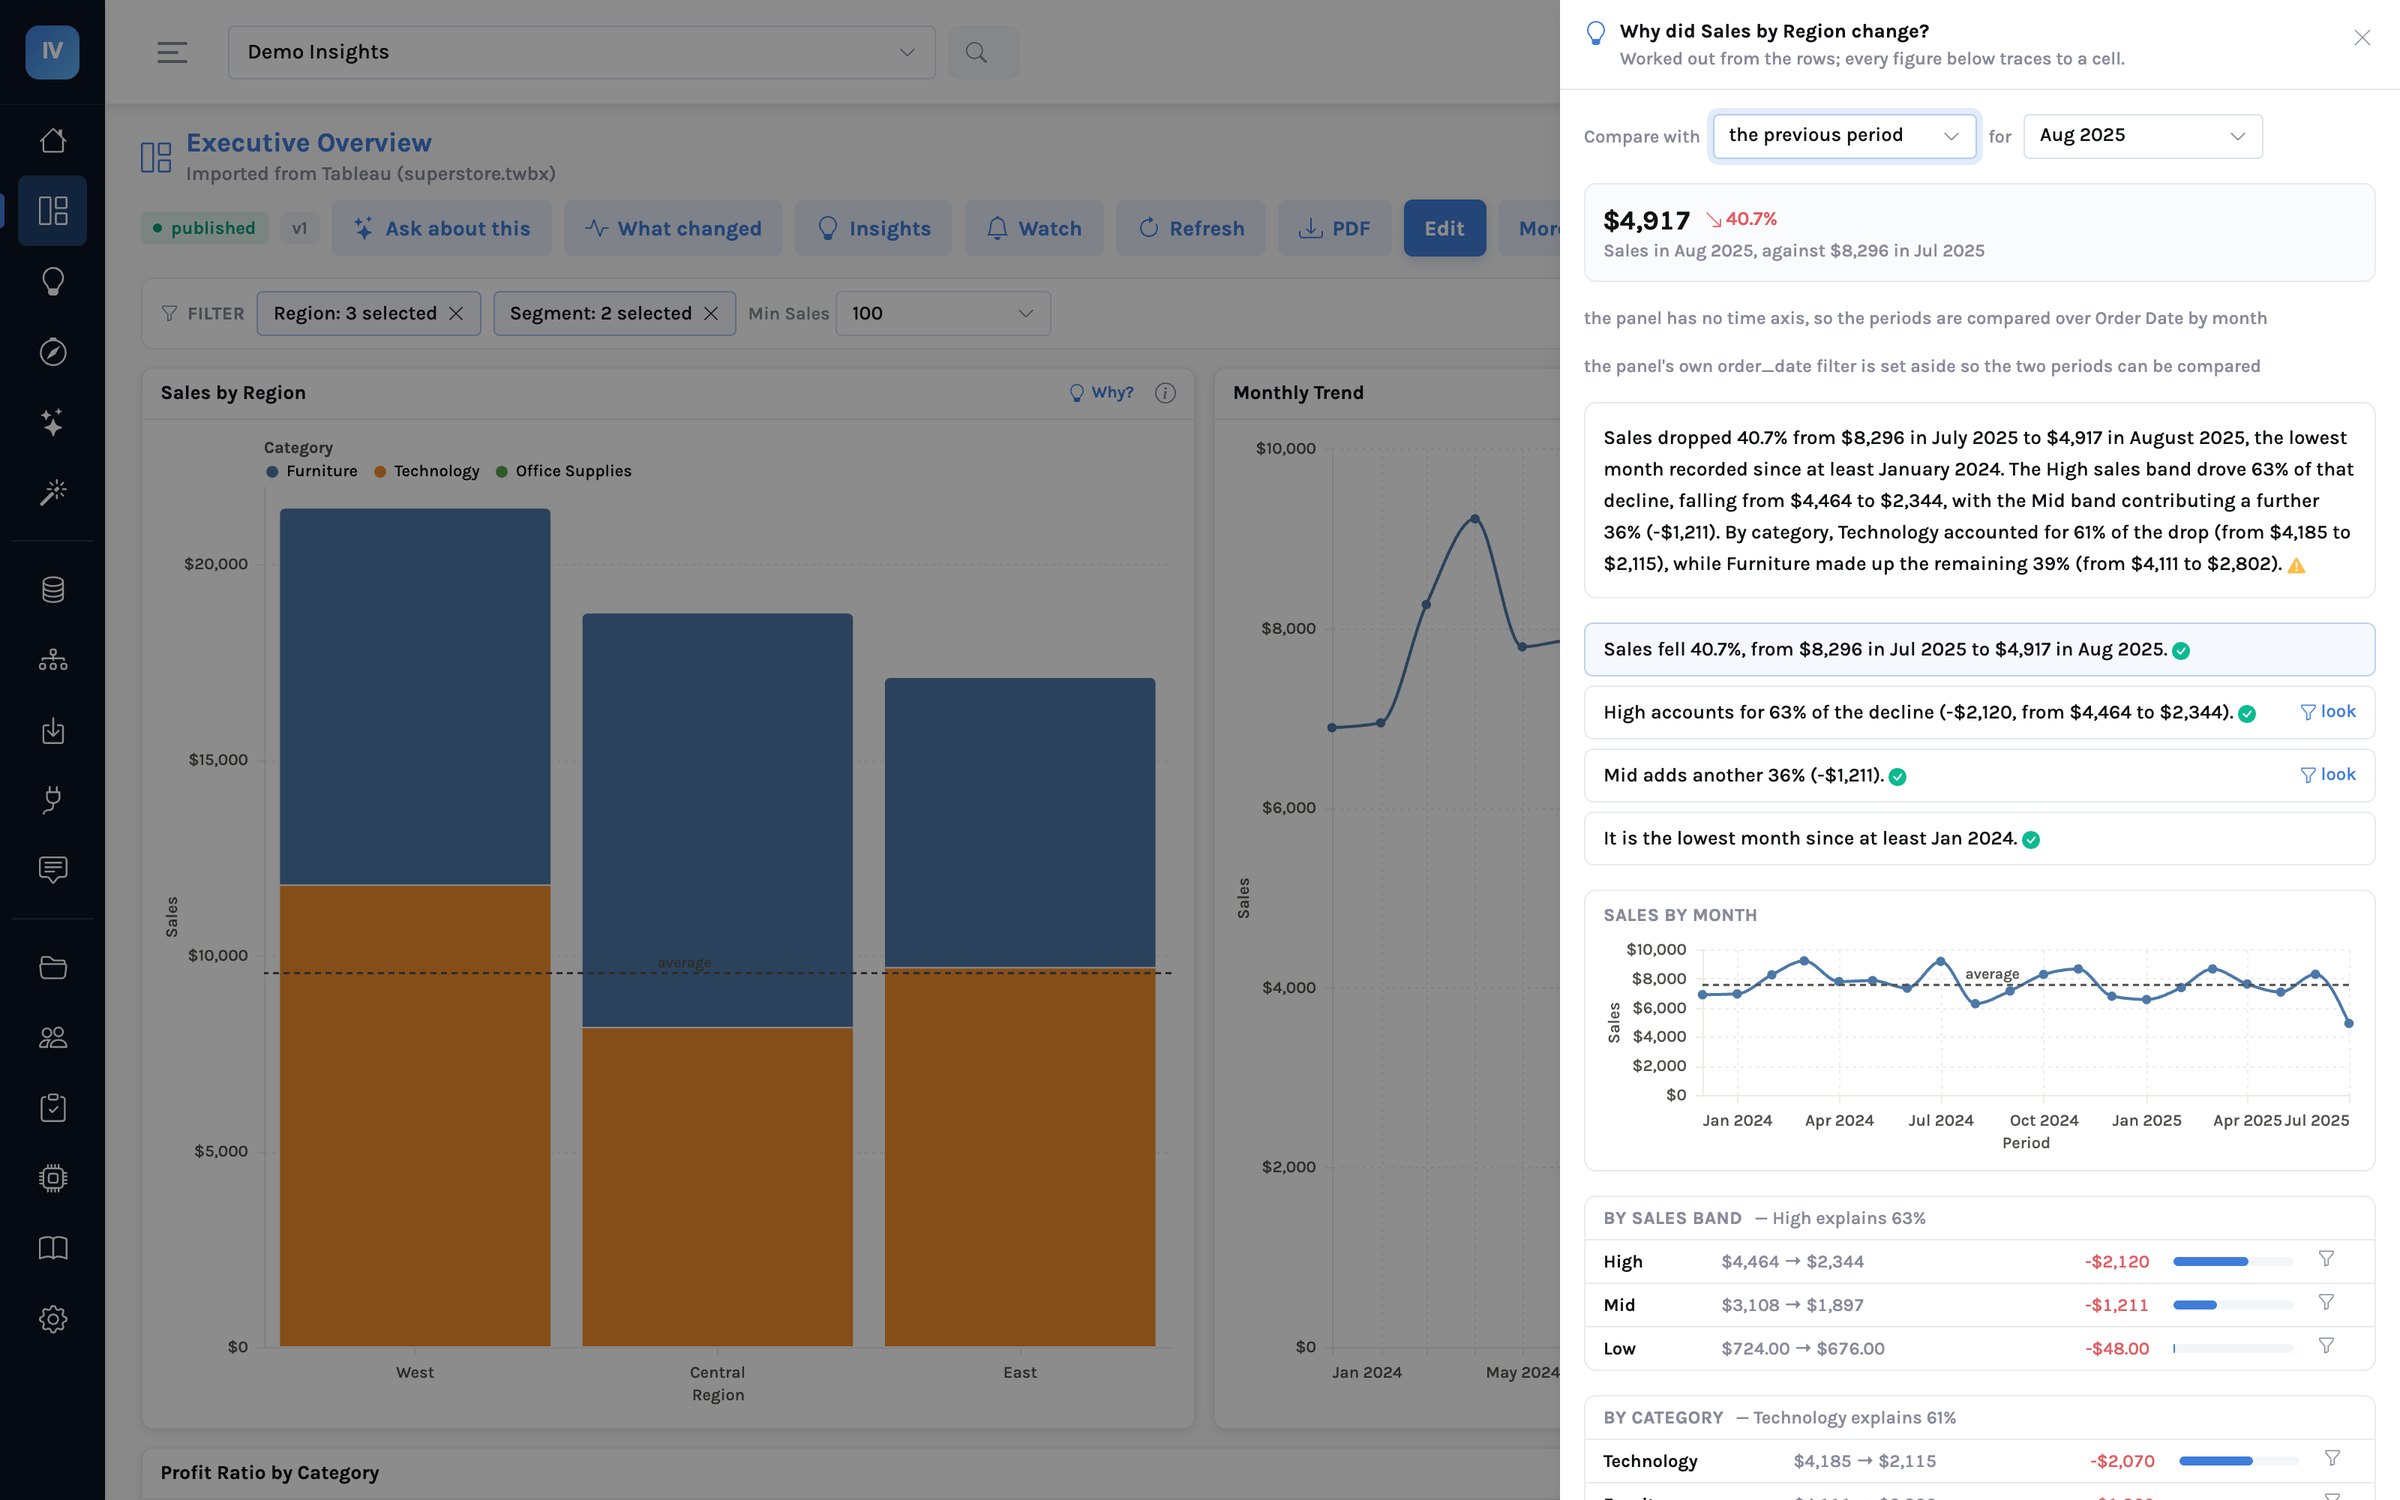
An explanation on the dashboard's own filtered view. The green mark beside each sentence means every figure in it traced back to a cell in the tables beneath; the four buttons at the bottom are the next step, each a single click.
From insight to action, without leaving the page
An insight that ends in a sentence is a report. An insight that ends in an action is a decision. The explanation therefore carries its own next steps, proposed from the numbers: look at the driver on its own narrows the whole dashboard to it; break the driver down runs the same explanation one level deeper; add the average as a reference line puts the context on the chart for everyone; alert if it falls below this again sets a threshold derived from the series' own variance, so the next occurrence is heard before the meeting rather than in it.
The same procedure runs across every panel of a dashboard, latest period against the one before, and ranks the moves. It is on the dashboard, on the home page across every dashboard a person can see, and in the body of the scheduled email above the attachment — so the person who receives the Monday PDF reads the two lines that matter before opening it.
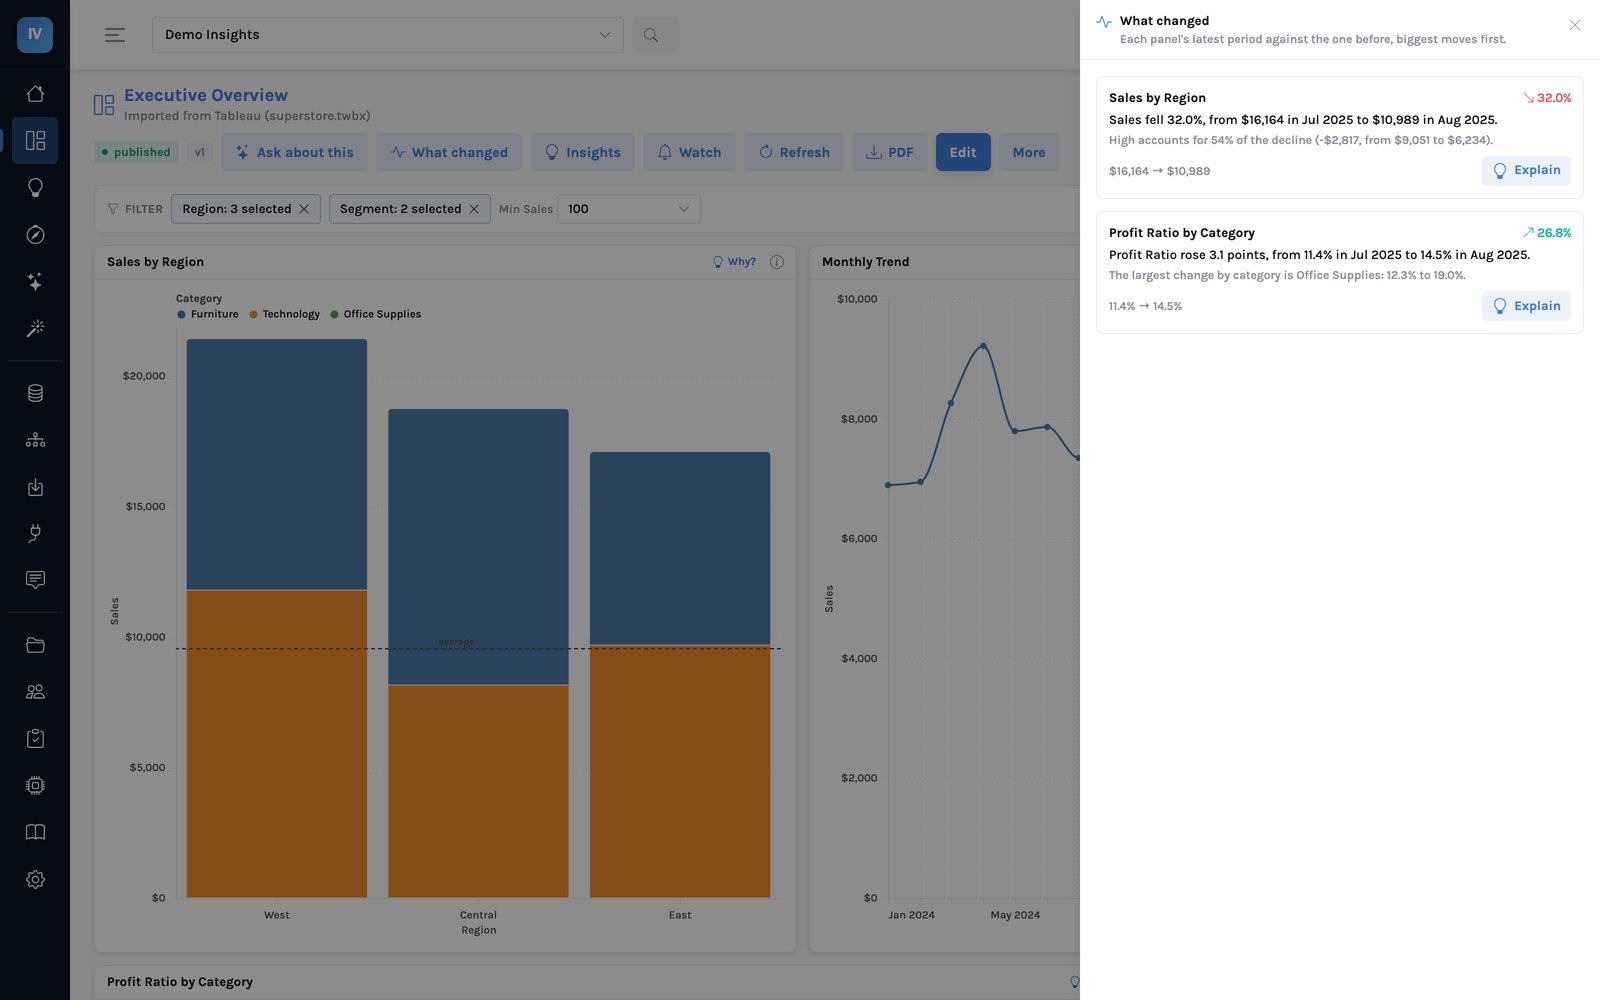
What changed, before anyone asks: each panel's latest period against the one before, the driver under each line, and the explanation one click away. Three panels showed the same sales figure in different shapes; the digest reports it once.
Talking to the data, in a governed way
The conversation is still there — it is simply no longer the front door. Under the explanation a manager can ask the follow-up in words: was it fewer orders or smaller ones? is this unusual for a month? what moved the other way? The answer is drawn from the evidence on the panel — the claims, the trend, the breakdowns — plus at most one further query through the same catalogue and rules, which is shown. When the evidence cannot answer, the assistant says exactly that and names what would. The rule is the one that holds everywhere in the product: an answer may only use what the rows support.
6 · Reference Architecture
The shifts above come together in five layers. The top is where the data already lives; the bottom is the surfaces people actually read. Every layer in between exists to turn the trust of the top into the speed of the bottom without losing either.
Your data, where it is
Warehouses, databases and files — Redshift, Snowflake, Databricks, Oracle, Postgres, MySQL, CSV and Parquet — and the Tableau or Power BI workbooks that already describe them. Read where they stand, or copied on a schedule into a governed store in your own cloud.
▼
The catalogue — definitions and rules as data
Dimensions, metrics, hierarchies and relationships with business names; row and column access rules attached to the dataset. Proposed automatically from a schema or a workbook, reviewed by people, versioned on publish.
▼
The compiler
Turns a logical question — these dimensions, these metrics, these filters — into SQL, with the reader's rules inside it. Deterministic, tested, the only thing that ever writes SQL. Every dashboard panel, exploration, explanation and AI answer goes through it.
▼
Reasoning and grounding
Explain: periods, contributions, ranking, trend, next steps — computed. Digest: every panel's move, ranked. Ask: a closed-world conversation over that evidence. A model writes prose; a grounding check traces every figure back to the rows before it is shown.
▼
Surfaces — where people read
Dashboards as reviewable, versioned documents; Explore; AI Ask; the scheduled email with the digest in it; embedded charts in your own applications. Every surface shows how a number was computed and which rules applied.
Two properties matter more than the boxes. It runs inside your environment — your cloud storage, your credentials sealed, your model endpoint or none — so business data does not leave, and a dataset marked server-only never reaches a browser. And it degrades honestly: a dimension the reader may not see is never tried; a period with no data is reported rather than compared; a summary that carries a figure the rows do not support is dropped with a note, not shown.
7 · What Leaders Should Do Next
This is a programme of work, not a procurement decision, and it earns trust before it asks for it: the definitions first, the explanations on the dashboards people already read, the conversation last.
- Measure the three numbers below
- Import the five most-read workbooks; read the fidelity report
- Settle the top ten metric definitions — once, in the catalogue
- Put Why on those dashboards; compare with what analysts said
- Set row rules on the data; retire per-workbook access
- Move the readers first — the largest group, the easiest
- Turn on the digest in the scheduled deliveries
- Open AI Ask to managers, on the governed catalogue
- Let alerts be set from explanations, by the people who read them
- Report the three numbers monthly
- Retire the unopened dashboards the audit found
- Make the catalogue the definition of record for finance
- Embed explanations in the operational apps people work in
- Extend across acquired estates and clouds
- Renew BI on readers who no longer need a seat
Measure your own starting point first
Three questions, answerable in a fortnight from systems you already have. Do not buy anything before you can answer them.
1 · What share of your dashboards were opened by anyone in the last ninety days? The usage export answers it in an afternoon, and the number is usually the largest surprise in the exercise.
2 · How many distinct definitions do your top five metrics have across finance, commercial and operations? Count the calculations, not the names. This is your actual project plan.
3 · What is the median time from a "why" question to its answer? Take ten questions from the last month's channels and tickets. This number belongs to no team, so nobody reports it.
Then time three questions by hand — an observation, not a survey. The assembly share from three real questions will be the most useful number in your business case, and it will be yours rather than a vendor's.
Final Thought
The advantage here will not come from access to AI models. Every organisation has that.
It will come from an organisation's ability to turn what it means by its numbers into a contract it owns — definitions and rules held as data — and to let software reason over that contract in a way a person can follow, check and act on.
The teams that manage this will answer in the meeting what used to arrive on Thursday, and their analysts will spend their mornings on questions that are actually new. The measure of success is not that AI answered the question. It is that nobody had to assemble the answer first.
Appendix A · BI Transformation
The dashboard explains itself. People decide.
Representative example · InsightViz
Management teams spend most of their analytical hours reconciling numbers and waiting for answers to why. InsightViz puts the reasoning on the chart: one governed catalogue every surface compiles from, an explanation of any change worked out from the rows, a conversation bounded by that evidence, and a check on every figure before a person reads it.
Traditional
People do the reasoning by hand.
A dashboard shows the number. Every why-question needs an analyst, six queries and a spreadsheet; the working is never recorded; the definition behind the number lives in the file and differs from the next file. Readers are priced like authors and rationed accordingly.
AI-Native
The chart reasons. People decide.
Why on every panel: periods, drivers, trend and next step, computed in under a second under the reader's own rules. What changed, ranked, on the page and in the email. A conversation that only uses the evidence and says so when it cannot answer. One definition of every metric, everywhere.
All the available options — and where InsightViz fits
Example Implementation
InsightViz
Why on every chart · What changed · AI Ask · Governed catalogue
- One catalogue — definitions and access rules as data, proposed from a schema or a workbook, versioned on publish
- A compiler, not a model, writes the SQL — the reader's rules inside every query, on every surface
- Explain — periods, contributions, ranking, opposite movers, trend and next steps, computed; five queries and under a second on the sample estate
- Grounding — every figure in a written sentence traced to a cell; an invented one drops the sentence
- Digest — every panel's move ranked, on the dashboard, on Home and in the scheduled mail
- Migration — Tableau workbooks import with a fidelity report; data, definitions, dashboards and filters come across
- Self-hosted — your cloud, your credentials sealed, your model endpoint or none; no viewer licence
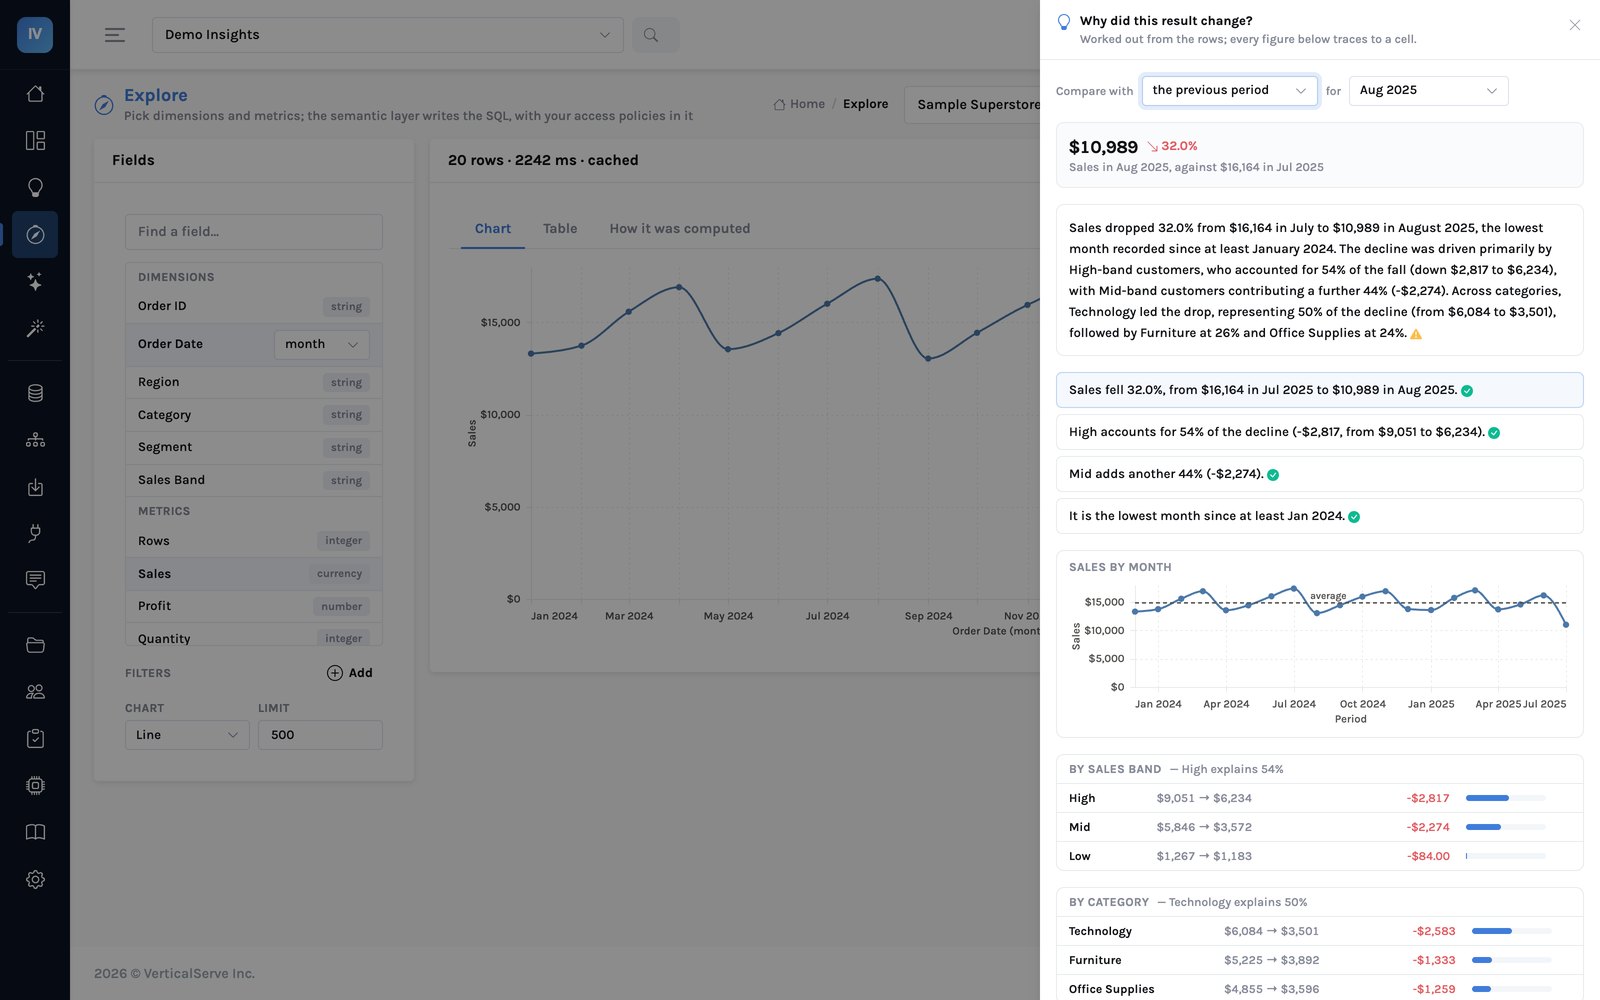
The explanation, in Explore
The pattern we see · Mid-market and enterprise · Tableau estates of 200–600 workbooks
A large reader population, a small analyst team, and a renewal that priced both the same. The estate audit found most workbooks unopened in ninety days and the top metrics under several definitions. Importing the read workbooks, settling the definitions once in the catalogue, and putting Why on the dashboards people already opened moved both of the variables the renewal was priced on — the seats readers needed, and the analyst hours the questions consumed — without rebuilding a single dashboard by hand.
Appendix B · A worked question
Sales fell in August. Why?
Representative example · InsightViz · the sample workbook every trial starts with
The question from section 2, asked of the sample dashboard that ships with the product, so the reader can reproduce every figure. The manager presses Why? on the sales panel. The procedure runs five governed queries in 0.3 seconds and writes four sentences. This is what they say, and where each came from.
- Sales fell 32.0%, from $16,164 in Jul 2025 to $10,989 in Aug 2025. — the figure per month; two cells and the ratio between them
- High accounts for 54% of the decline (−$2,817, from $9,051 to $6,234). — sales by sales band in both months; the band's change over the total change
- Technology explains 50%; Corporate explains 50%; East explains 39%. — the same figure by category, segment and region: broad, none of them the story
- It is the lowest month since at least Jan 2024. — the twenty months on the trend
Notice what the ranking did. Three dimensions each have a member that "explains" about half the decline. That is not three causes; it is what an even split looks like when a dimension has two or three members. The procedure scores each dimension by how far its leader sits above an even split, so a genuinely concentrated driver ranks above a large member of a small dimension. When nothing is concentrated it says so: the decline is broad; no single region explains more than 39% of it.
| Step | What the manager did | What the system did |
|---|
| 1 · Look | Clicked Look at High on its own. | Narrowed the whole dashboard to the High band; every chart followed. |
| 2 · Deeper | Clicked Break High down by category. | Ran the same explanation for High only: Technology inside the High band fell hardest. |
| 3 · Ask | "Is this unusual for a month?" | Answered from the twenty months on the panel: the largest single-month fall and the lowest level; the previous low was February 2024. Nothing outside the panel was consulted. |
| 4 · Ask | "Was it fewer orders or smaller ones?" | The panel carries no order count, so one further governed query ran — sales and order count for the two months — and was shown under the answer. |
| 5 · Watch | Clicked Alert if Sales falls below $11,485. | Set an alert on the panel, to her, Monday mornings: two standard deviations under the twenty-month average. |
Every step is either a click on something already computed or a question answered from the panel's own evidence. The one time the evidence was not enough, the assistant ran one more governed query and showed it — it did not guess, and it did not go and read the whole warehouse. The question that needed a person — why did those customers order less — is the one the system declined to answer, in one sentence, naming what would.
Why this case is the benchmark
Ask any vendor to show you this one. An assistant that answers a question is easy to demonstrate. An assistant that shows which of its figures came from a row, ranks a broad change honestly instead of naming a cause, and declines the question the data cannot answer is a far better test of whether the system understands its own limits.
Appendix C · What the record looks like
The artefact a finance director reads, and the trail an auditor asks for.
Representative example · InsightViz console
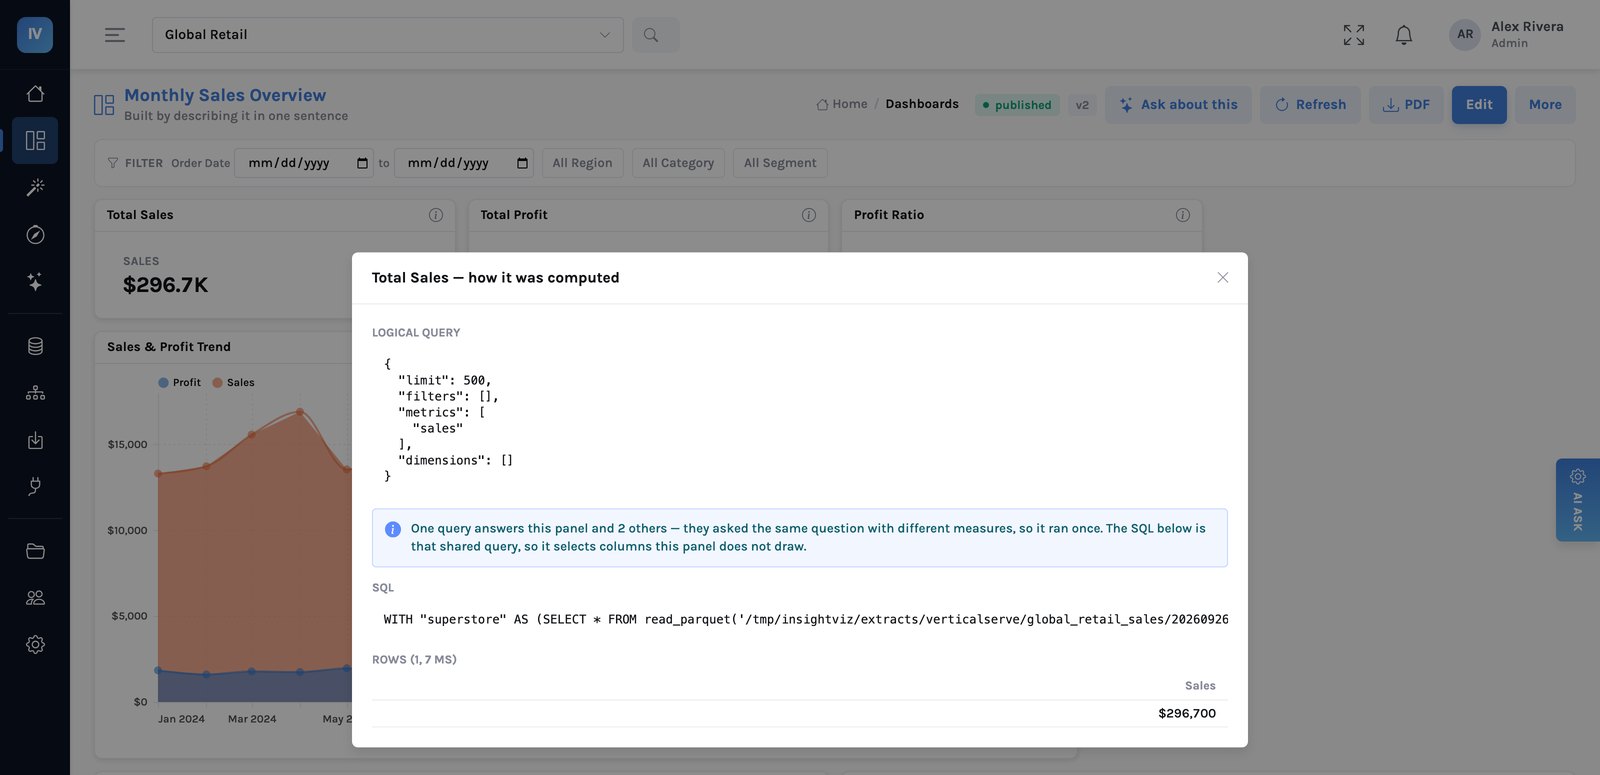
Every panel, exploration and answer carries this: the question as data, the SQL the compiler wrote, the rules that applied, the rows. Nothing on a screen cannot be traced.
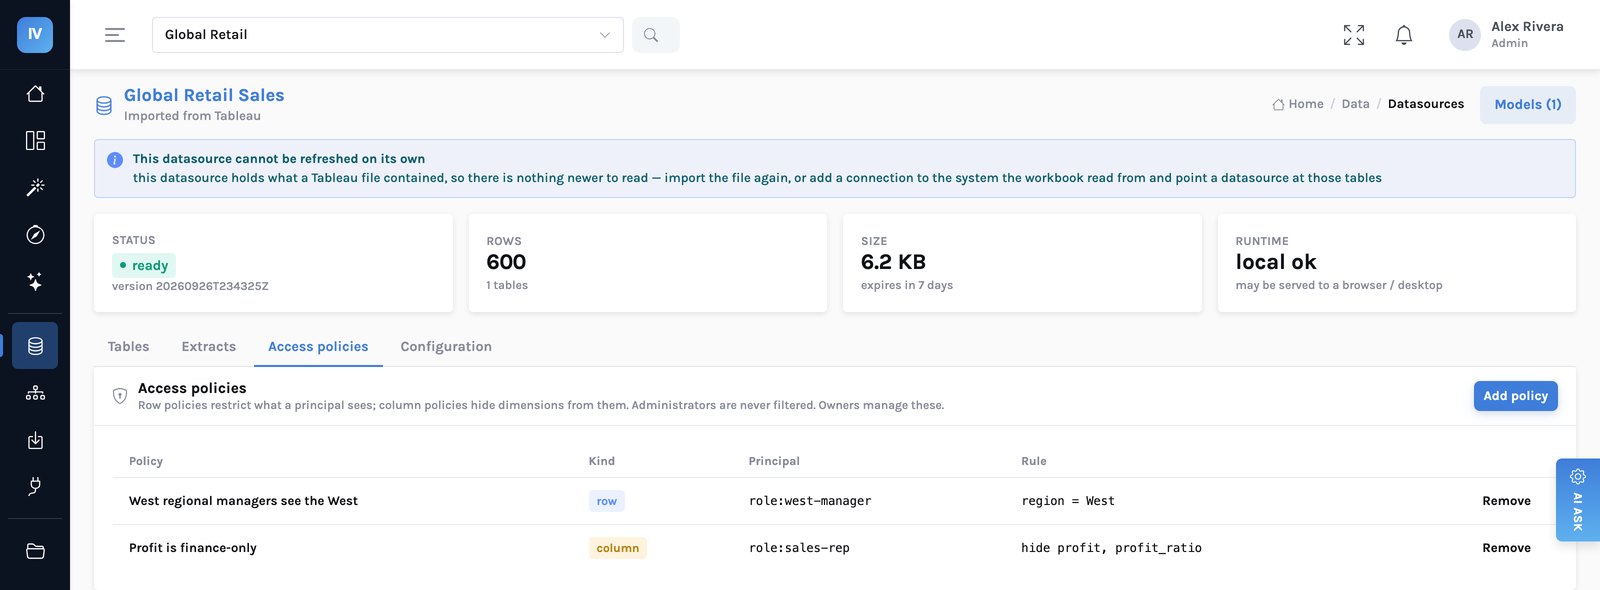
Rules live on the data, not the file: set once, applied to every dashboard, every exploration and every AI answer — including every query an explanation runs.
Three properties of this record make the approach defensible to a risk function. It is complete — every query, the rules that applied, who asked and when, including the questions that were refused. It is attributable — each figure in a written sentence names the cell it came from, and one that cannot be traced is flagged rather than smoothed over. And it is bounded — the assistant's reach is the catalogue the person was shown, so there is no answer it could have computed on data they could not see.
The test to apply. Take five why-questions your managers asked last month, and give the system the dashboard they were looking at. Did it find what your analyst found? On the ones where the data could not answer, did it say so, or did it produce a cause? And what did it do for a reader who may only see one region? The second question is the whole evaluation: a system that answers every question confidently is unusable in a boardroom, while one that answers most of them and declines the rest out loud is something a CFO will read.