Pull your BI licence list and sort it by what people actually do. In most estates the shape is the same: a small group who build, a slightly larger group who edit occasionally, and a long tail — often eighty per cent or more — who have never authored anything. They open a dashboard someone else built, change a filter, read a number and close it.
That long tail is the bill. And because it is priced per head, it is also the thing your organisation quietly optimises against.
pie showData
    title Where the licences go
    "Open a dashboard and read it" : 78
    "Edit occasionally" : 16
    "Build and publish" : 6
Three things fell out of that table within an hour, none of which the total had shown.
- Viewers are 52% of the bill and 84% of the seats. They author nothing.
- 478 viewer seats had not logged in for a quarter \u2014 £68,832 a year for people who did not open anything.
- Reserved capacity was sized against a 2021 peak that had not recurred, and nobody owned the line.
The negotiated discount on offer was 6%, or about £18,000. The unused viewer seats alone were nearly four times that, and they were invisible until somebody asked for the breakdown.
Four costs, only one of which is on the invoice
Finance sees the renewal. The other three never appear on a budget line, which is exactly why they persist.
| The cost | What it looks like | Where it shows up |
|---|---|---|
| The invoice | Per-seat licensing for people who consume and never create. Renewals move with headcount rather than with value delivered. | Annual renewal |
| Rationed access | Someone decides who is worth a seat. The decision is made on budget, not on who needs the number, and it is made once a year. | Nowhere — it looks like prudence |
| Screenshot distribution | People without seats still need the number, so it reaches them as an image in a deck: undated, unfiltered, and stale by the time it is presented. | A decision made on an old number |
| Shadow reporting | A spreadsheet is free. Every rationed seat is an argument for one more extract into Excel, where none of your governance applies. | A compliance finding, eventually |
The fourth one deserves a moment. Every organisation that rations BI access grows a parallel reporting estate in spreadsheets, and that estate has no row-level security, no audit trail, no refresh schedule and no owner. It is the direct output of a pricing model, and it is usually discovered during an audit rather than during a budget review.
The second-order cost is worse than the first
An organisation that rations data access gets worse at making decisions, in a way that never appears on a budget line. The invoice is visible. The meeting that went the wrong way because the number arrived as a three-week-old screenshot is not.
Why it is priced this way
Not malice — architecture. When the vendor hosts your data and runs the engine, every viewer is a real cost to them: storage, compute, a session held open. Per-seat pricing is a rational way to recover that, and it worked when BI meant a few hundred analysts inside a reporting function.
It stops working the moment the honest answer to who should see this? is everyone who could act on it — which, for an operational dashboard, it usually is. The warehouse manager who could fix the delivery problem is not in the reporting function and does not have a seat.
The pricing model is not charging you for value. It is charging you for the vendor’s hosting costs, in a unit — the human being — that has nothing to do with them.
What changes when the data is already yours
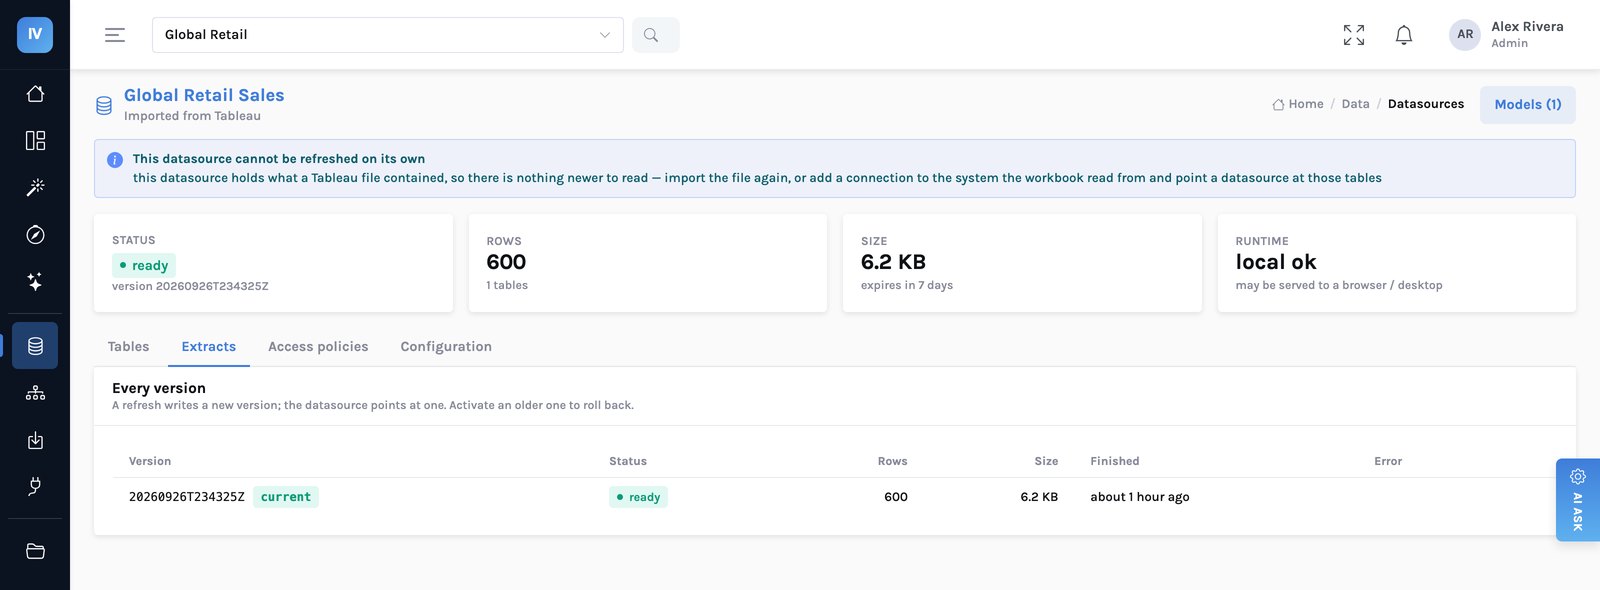
InsightViz keeps a governed copy of your data in your own cloud storage, in an open format, and the query engine is part of the product. There is no vendor hosting your data and no per-session cost for anyone to recover, so there is no reason to charge for someone who only reads.
flowchart LR
    A["Your source systems"] --> B["A governed copy
in your cloud storage"]
    B --> C["Business definitions
one vocabulary"]
    C --> D["Dashboards"]
    C --> E["Explore"]
    C --> F["Ask in plain words"]
    D --> G["Everyone who
could act on it"]
    E --> G
    F --> G
    style B fill:#eef1ff,stroke:#c7cdf2
    style C fill:#eef1ff,stroke:#c7cdf2
    style G fill:#e6f7f2,stroke:#9fd8c9
The storage is the boring part and the important part. It is Parquet on your own object store — S3, Azure Blob or Google Cloud Storage, in your account, under your keys. Any tool that reads Parquet can read it, including the next BI tool you buy. That is the difference between a copy of your data and a hostage.
What the people who only read actually get
Removing the seat charge only matters if the tool is usable by someone who was never trained on it. Four things carry most of that weight:
| What they do | How it works | What it replaces |
|---|---|---|
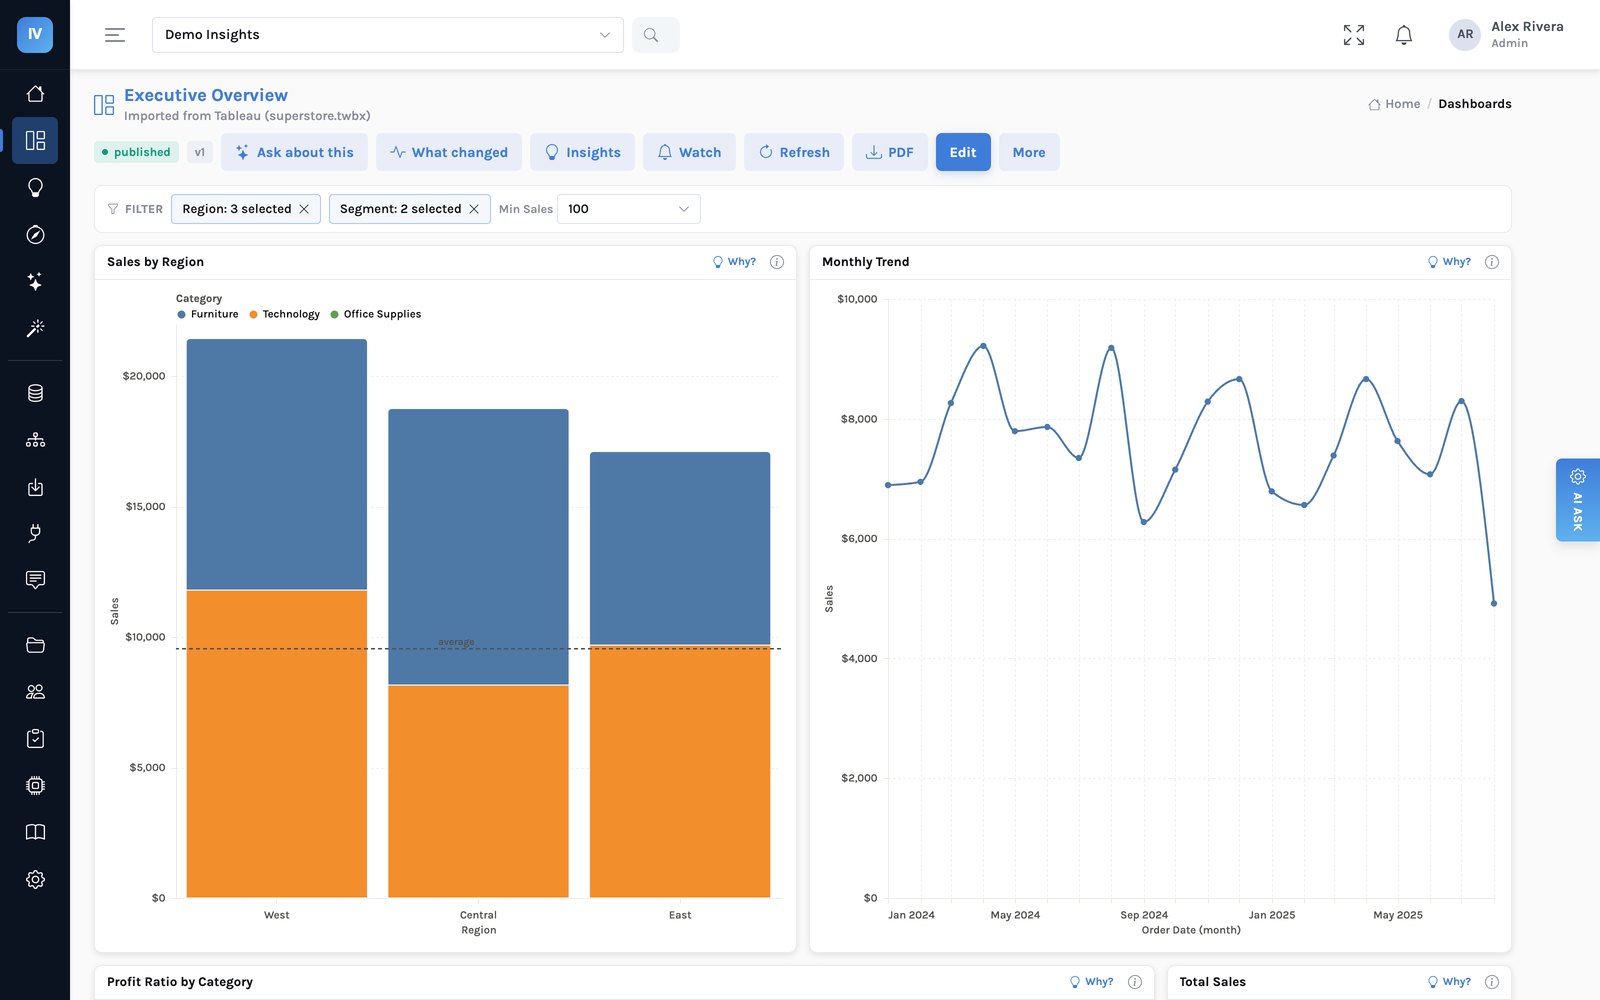
| Filter | Controls across the top come from the business dimensions, so they read like the business rather than like a table of columns. | A request to the analyst who built it |
| Cross-filter and drill | Click a bar and the rest of the page follows. Click again to go a level deeper — region, then category, then product. | A second dashboard for the same question |
| Export | Any dashboard downloads as a PDF or an image, sized to the dashboard rather than paginated onto A4. | The screenshot pasted into a deck |
| Ask | The assistant is on every page for the follow-up the dashboard does not answer, bounded by the same definitions and the same access rules. | A ticket, and a three-day wait |
Note what the last row replaces. Most of a BI ticket queue by count is small questions — break this down by segment, compare it with last quarter — and those are the ones that make analysts feel like a service desk. They stop being tickets.
The honest limits
Three, because a pricing argument that admits nothing is a pricing argument nobody believes.
- Someone still pays for the compute. It moves from a licence line to your cloud bill. For most estates it is dramatically cheaper — a dashboard reads aggregated Parquet, not the warehouse — but it is not free, and it is a line you now own.
- You need somewhere to run it. An AWS, Azure or GCP account, and someone who can deploy into it. If you have no cloud footprint, the hosted option exists, but then you are back to paying someone for hosting — just not per reader.
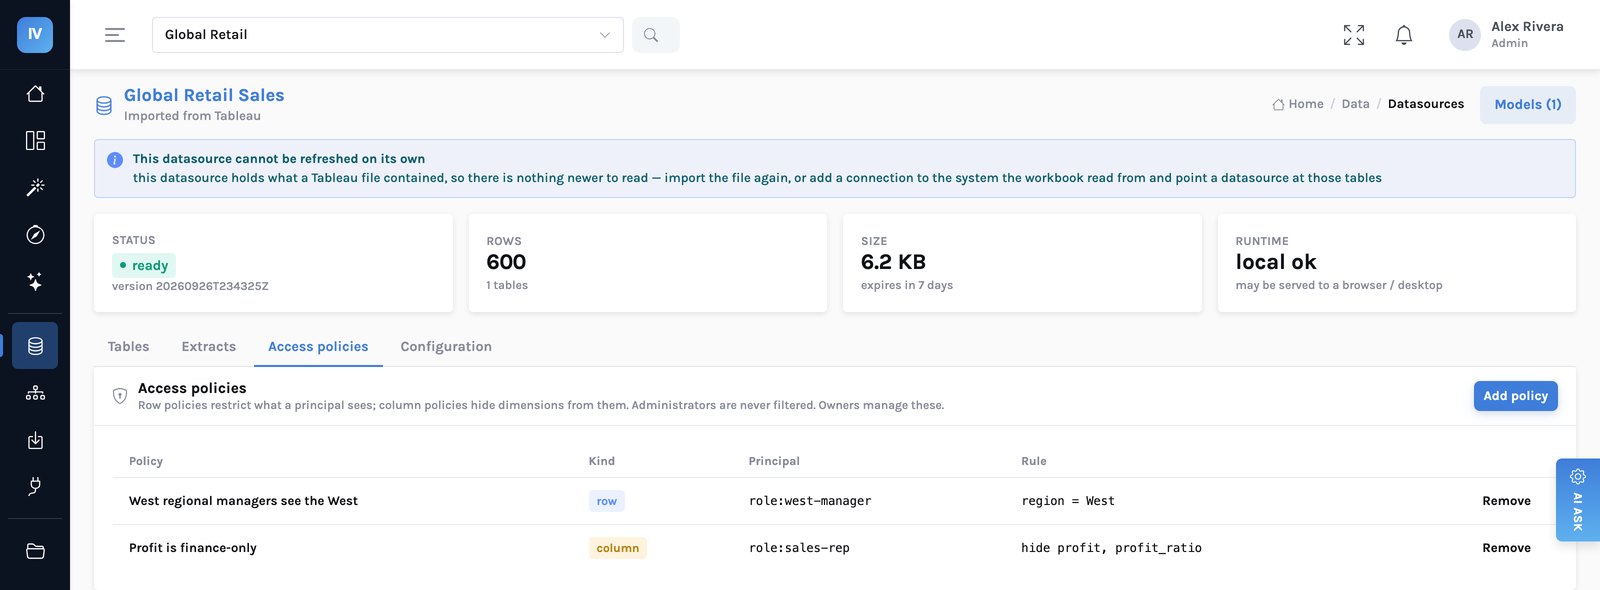
- Governance becomes your job. When everyone can see the data, who sees which rows matters more, not less. The rules are set once on the datasource rather than per workbook, which is the better design, but the first set you write will be wrong and will need revisiting.
The question to take to your renewal
Not “can we negotiate the rate?” — you can, by a few per cent, once a year. The question is:
How many people in this organisation would be better at their job if they could see this, and what are we paying to stop them?
If the answer to the second half is most of the invoice, that is worth an afternoon. The full business case →