It starts reasonably. Someone builds a workbook with a calculated field called Net Revenue. A second team needs almost the same thing, so they copy the workbook and adjust it — their business excludes intercompany transfers. A year later a third team builds their own from scratch because they could not find the first two.
Now there are three definitions of net revenue, all correct in their original context, all called the same thing, and none of them visible to anyone who has not opened the file.
A £4.3m spread on the same quarter, and every one of the three reconciles perfectly against itself month over month. That is why nothing looks wrong until two of them meet.
- 2019One definition
Sales builds a workbook with a calculated field. It is correct for sales commission, which is what it was for.
- 2021A second, for a different purpose
Finance needs a statutory-aligned figure and cannot see how the sales one is defined, so they build their own. Also correct — for their purpose.
- 2024A third, by accident
A new ops analyst searches the estate, finds four hundred dashboards, cannot tell which figure is authoritative, and builds a fresh one. Also correct.
- The board meetingAll three in one room
Sales presents £62.4m growth against target. Finance’s pack says £58.1m. Forty minutes of the meeting goes on establishing that both are right, and the agenda item they were there for is carried.
- AfterwardsThe real damage
Nobody trusts a number they did not produce. Three teams start keeping their own, which is how a fourth definition gets created.
Why it is invisible until it is expensive
Drift has no symptoms until two of the copies meet. Each team’s number is internally consistent and reconciles with itself month over month, so every dashboard looks healthy. The divergence only surfaces when two teams present to the same audience — usually a board pack, usually at the worst time.
flowchart TD
    subgraph one["One definition"]
        D1["Net Revenue
defined once"] --> W1["Every dashboard"]
        D1 --> W2["Every exploration"]
        D1 --> W3["Every AI answer"]
    end
    subgraph many["A definition per workbook"]
        A["Net Revenue
Sales team"] --> AA["Sales dashboards"]
        B["Net Revenue
Finance, minus intercompany"] --> BB["Finance dashboards"]
        C["Net Revenue
Ops, rebuilt in 2024"] --> CC["Ops dashboards"]
    end
    style D1 fill:#e6f7f2,stroke:#9fd8c9
    style A fill:#fdecec,stroke:#eab6b6
    style B fill:#fdecec,stroke:#eab6b6
    style C fill:#fdecec,stroke:#eab6b6
The cost is not the reconciliation work, painful as that is. The cost is that after the second or third occurrence, people stop trusting any number they did not produce themselves — and start keeping their own. That is the point at which a BI estate has failed at its actual job, regardless of how many dashboards it contains.
The tell
If your finance function routinely rebuilds numbers that already exist on a dashboard before putting them in a pack, you already have this problem. The rebuild is not diligence. It is a rational response to not being able to see how the dashboard figure was defined.
Four things that make drift inevitable
| Property of the tool | What it causes |
|---|---|
| The definition lives inside the artefact | There is no “the” definition to point at. Every copy is equally authoritative, because every copy is the original as far as its file is concerned. |
| Copying a workbook is the fastest way to start | The path of least resistance is duplication. Every new use case forks the definitions it inherits, silently. |
| Nobody can diff two versions | A change to a calculated field is a re-saved binary. There is no review step because there is nothing to review. |
| Search does not reach inside files | The third team genuinely could not find the first two. They were not careless; the estate is not searchable. |
None of these are bugs. They are consequences of the file being the unit of work. Any tool built that way produces the same outcome given enough time and enough teams.
Defining it once, where everyone can see it
In InsightViz the definitions are not inside the dashboards. They are a separate, versioned object — the business model — that dashboards, explorations and AI answers all draw on. A metric has a business name, the expression behind it, a description, and the other words people use for it.
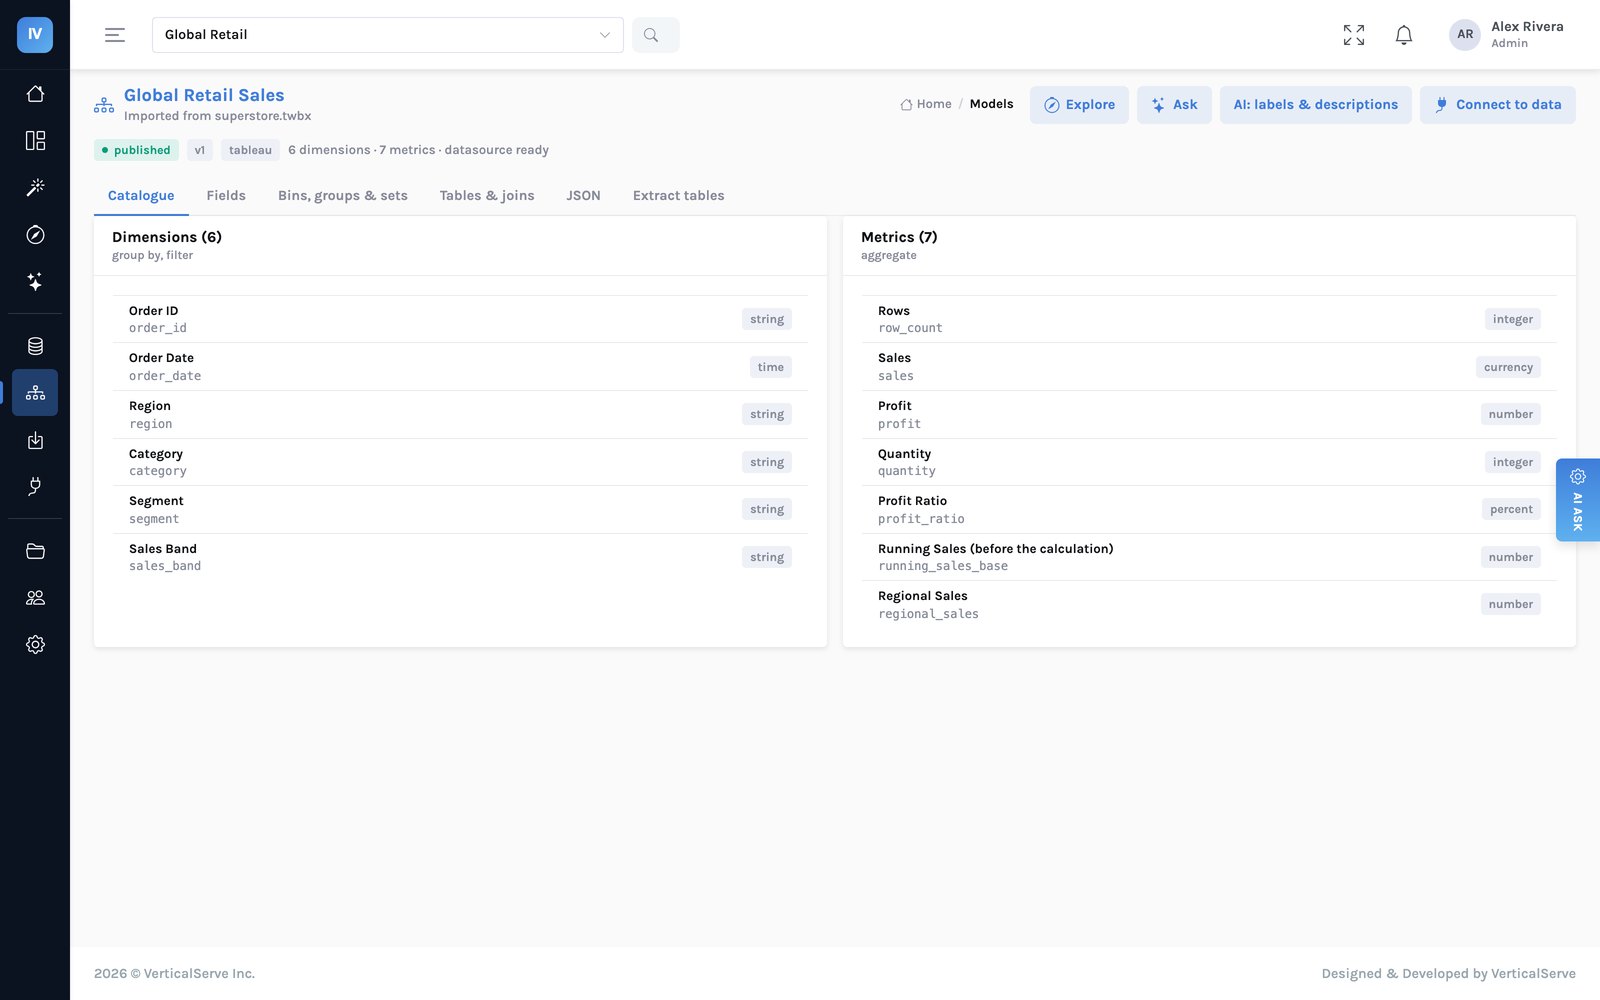
Net revenue exists because someone typed a formula into a calculated field. It is discoverable only by opening that file and reading it, and changing it changes exactly one dashboard.
Net revenue is a named metric with a description and an owner. Every dashboard references it rather than restating it, so there is one place to look and one place to change.
The part that is actually hard
Here is the concession, and it is a large one: no tool settles your definitions for you. Putting them in one place makes the disagreements visible; it does not resolve them. When three teams' definitions land in one model, somebody has to decide which one net revenue means — and that is a business decision with consequences for people's targets.
What changes is that the argument happens once, deliberately, in week three of a migration, instead of repeatedly and by accident in board meetings for the next five years.
The migration does not fix your metric definitions. It forces you to have the conversation you have been avoiding, at a moment when you have budget and attention for it.
In practice this is the most valuable phase of a BI migration and the one most likely to slip. Plan for it: two or three weeks, the people who own the numbers rather than the people who own the tool, and a decision log. The import gives you a first draft — every field the workbooks already named — so the conversation starts from what exists rather than from a blank page.
Why this also decides whether AI is useful
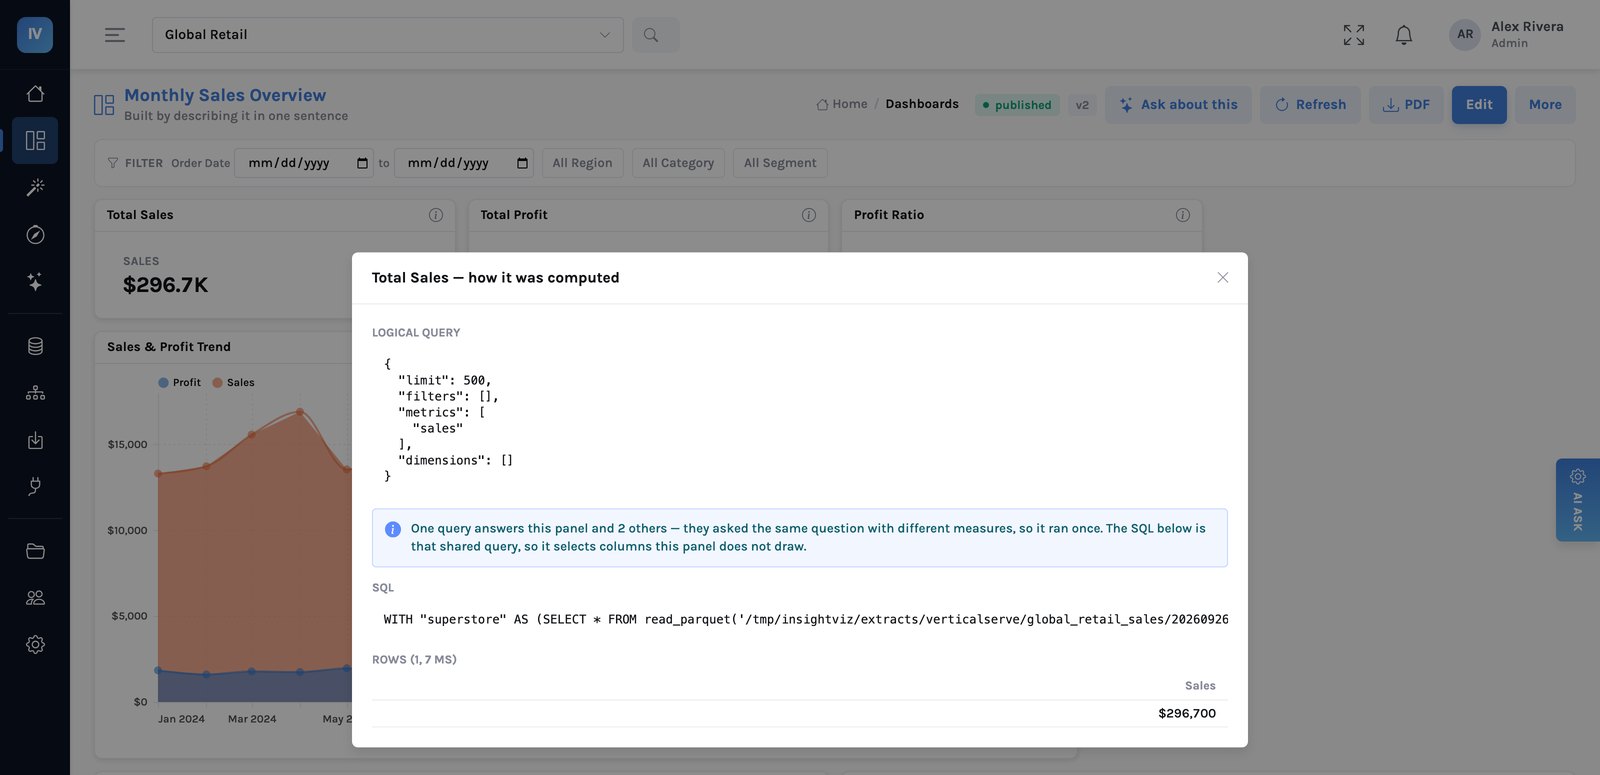
An assistant answering questions about your data is only as trustworthy as the vocabulary it is limited to. Point one at three conflicting definitions of net revenue and it will confidently pick one — and you will have industrialised the drift rather than fixed it.
This is the part most AI-for-BI pitches skip. The model is not the hard problem. The hard problem is that most organisations cannot state, in one place, what their own metrics mean — and until they can, every answer is a guess with good grammar.
Where to start, if this is familiar
- Count them. Search your estate for the three or four metrics that appear in board packs. How many distinct definitions are in circulation? The number is usually worse than the guess.
- Import a few real workbooks. The field names and calculations come across as a first draft of the model, which is a far more productive starting point than a workshop with a whiteboard.
- Settle the top ten, not all of them. A small number of metrics carry almost all the decisions. The long tail can drift for another year without anyone noticing.
- Write down who owns each one. Drift resumes the moment a definition has no owner, whatever tool it lives in.
The full business case → · Why the vocabulary decides whether AI is useful →