- contact@insightaiviz.com

Replace Tableau and Power BI with React dashboards, a governed semantic layer, and an AI that answers in plain words.
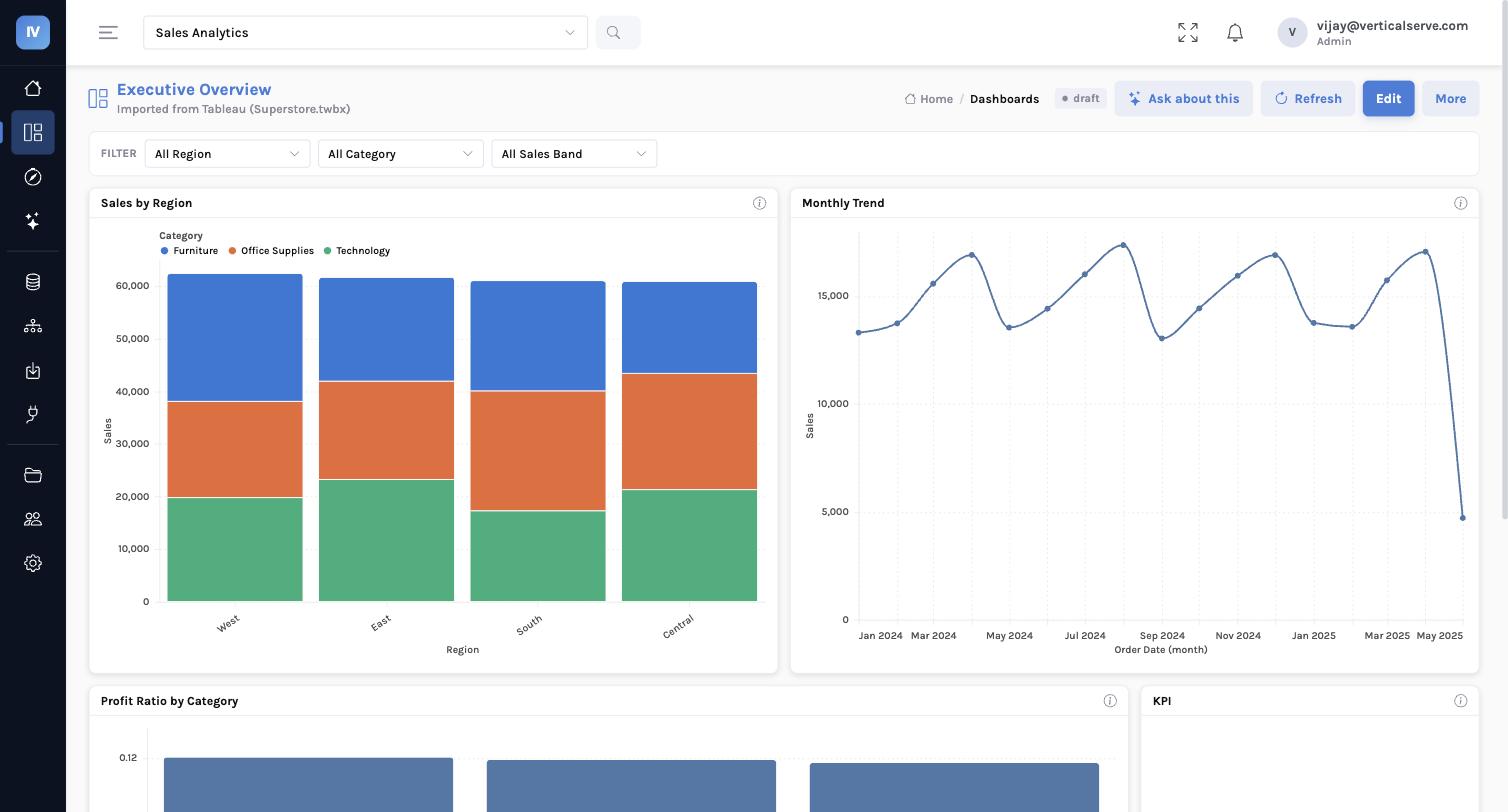
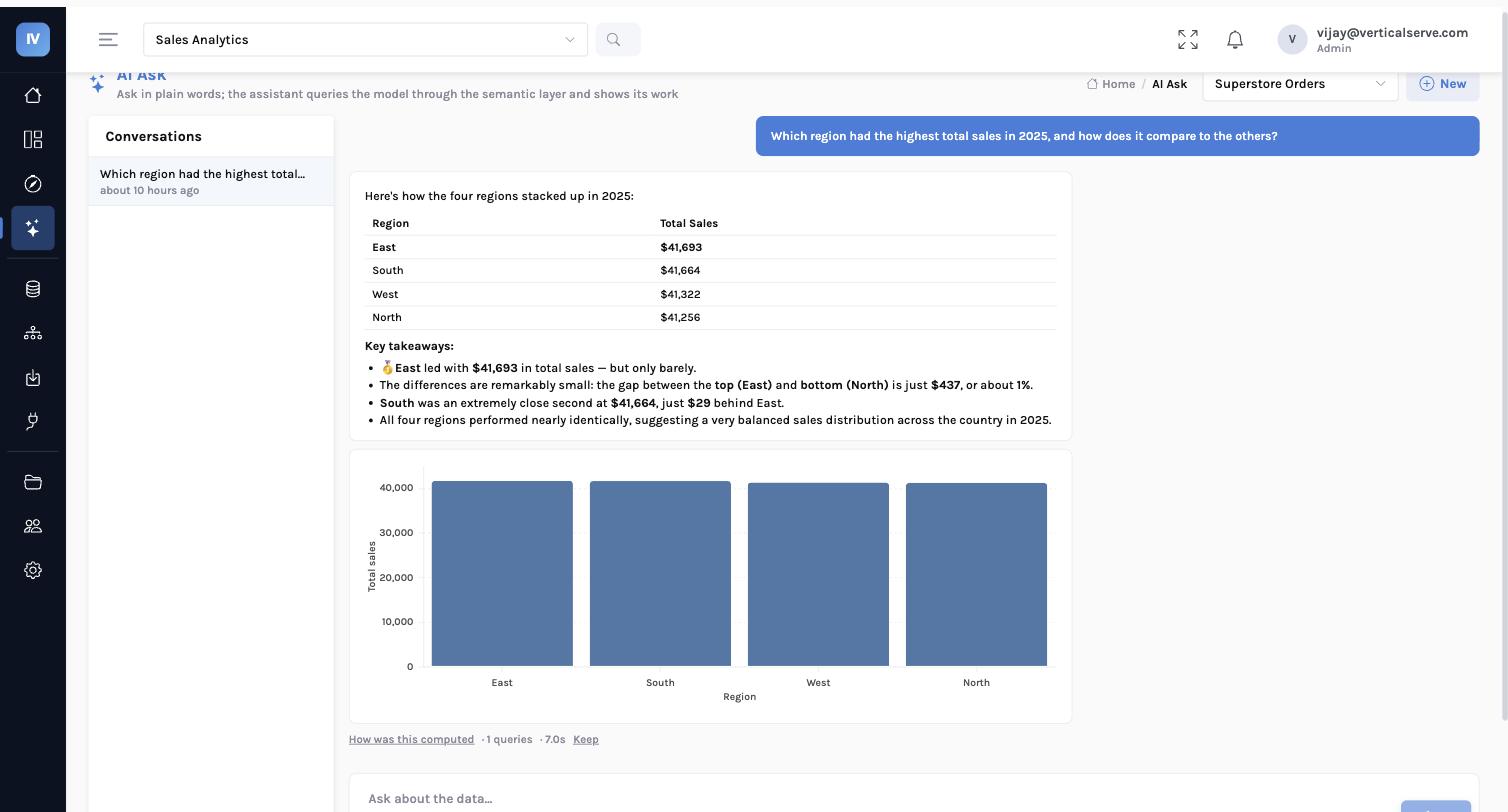
Drop a Tableau workbook and the data, the model and the dashboards come across. Extracts are Parquet in your own cloud; DuckDB answers in milliseconds; every AI answer shows the query it ran and what it was allowed to see.


Dashboards became binaries nobody could review. Metrics meant different things in every workbook. And asking a new question meant filing a ticket. InsightViz fixes the model, not the chart.
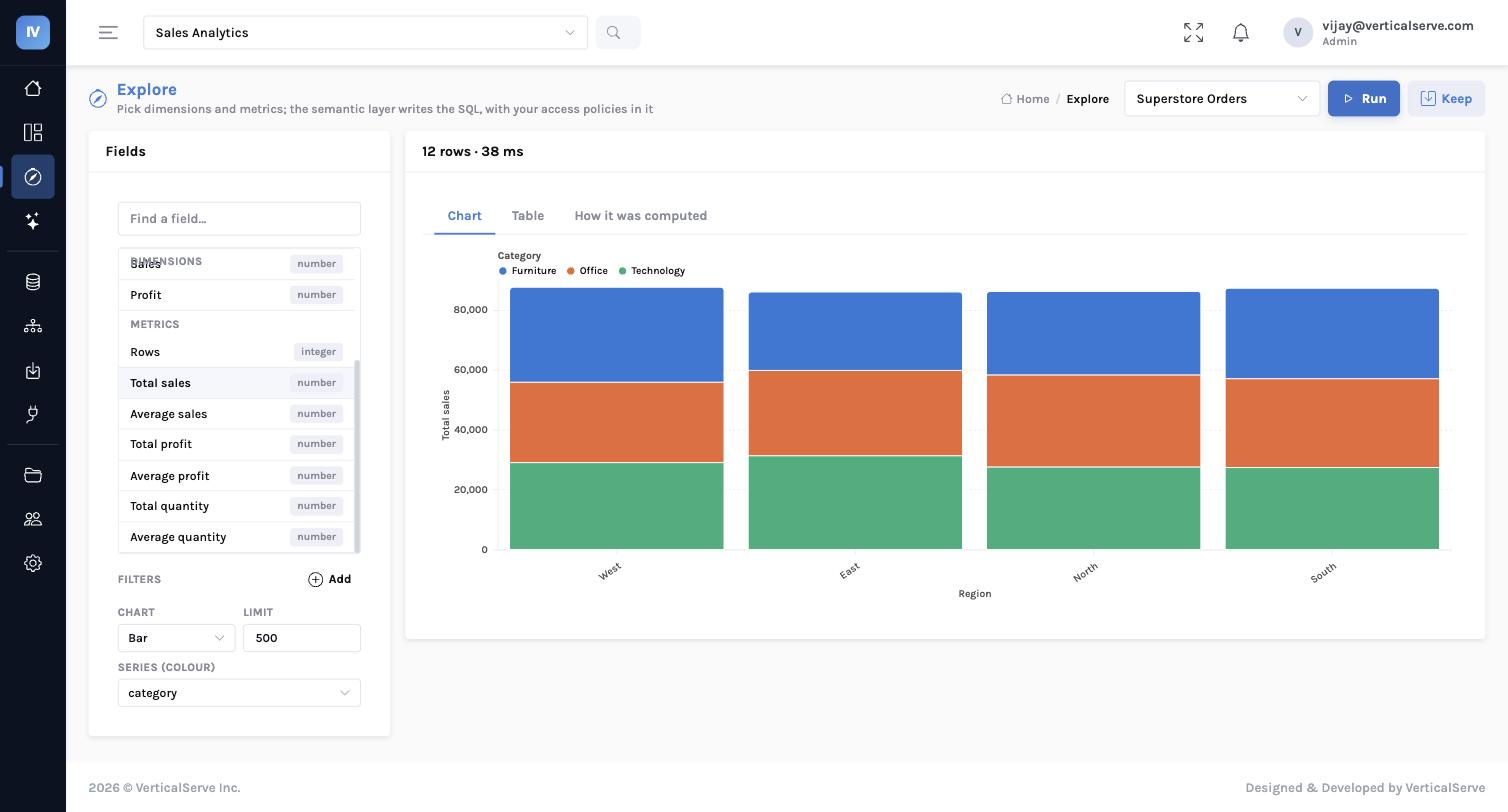
The assistant never sees a table or writes SQL. It picks dimensions and metrics from your semantic layer; the compiler writes the query with your access policies in it.
A dashboard is JSON: widgets, each with a logical query and a chart spec. Diff it, version it, let the AI write it, promote it from dev to prod like code.
Remote sources are pulled into versioned, partitioned Parquet in your object store. DuckDB answers in milliseconds — on the server, and soon in the browser.
Five steps, every one of them a row you can inspect.
Add a database or drop files. Credentials are sealed in the connection registry and never leave the server.
Tables become partitioned Parquet with a manifest. Each refresh is a new version; the pointer flips atomically.
A semantic model is derived on the first extract: dimensions, metrics, joins with business names. The AI enriches it.
Pick fields, see the chart and the table, keep it, add it to a dashboard. Or let the assistant do it.
Workspace roles, row and column policies, and a query log of who asked what — refused queries included.
Explore, AI Ask, dashboards and the Tableau import — on the shared VerticalServe shell your teams already know.
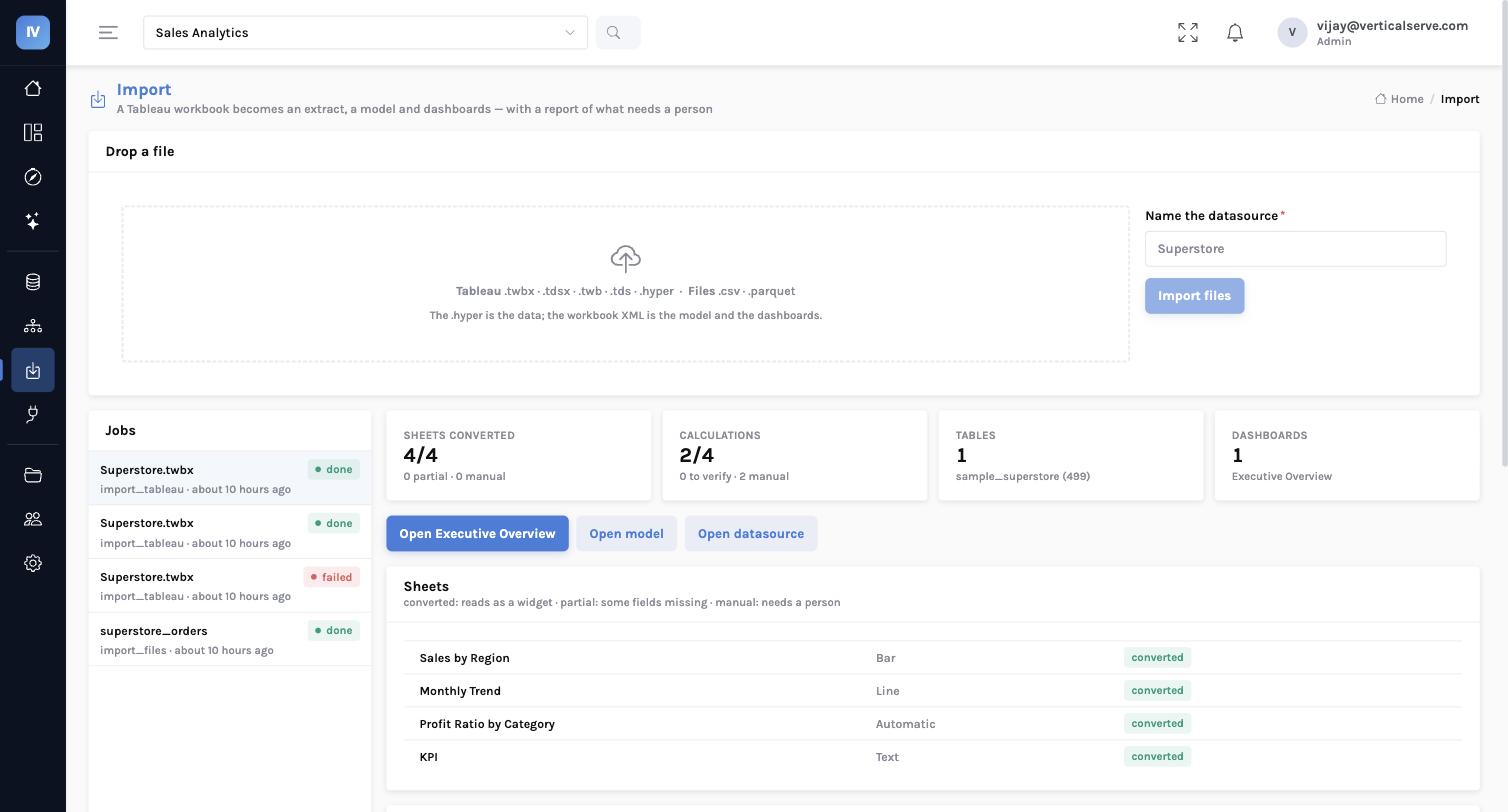
The .hyper is the data. The workbook XML is the model and the dashboards — and that is what gets migrated.
Every table in the Hyper extract becomes Parquet in your store. Row counts and columns are recorded so the catalogue is ready at once.
Captions, roles, aggregations, hierarchies and calculated fields become the semantic model. Calcs are translated to SQL; LOD and table calcs are flagged for a person.
Worksheets become widgets (marks and shelves map to chart specs); dashboard zones snap to a grid. You get a fidelity report, not a surprise.
| Tableau / Power BI | InsightViz | |
|---|---|---|
| Dashboard format | Opaque XML / binary; no code review | JSON documents, versioned, diffable, AI-editable |
| Metric definitions | Per workbook; drift across teams | One semantic model per datasource; used by dashboards and AI alike |
| Ask a new question | Rebuild a sheet, or file a ticket | Ask in plain words; keep the answer as a widget |
| Row-level security | Per workbook, easy to forget | Policies on the datasource, injected by the compiler on every query |
| Viewer cost | Per-seat licences for people who only look | Extracts in your bucket; DuckDB does the work |
| Where the data lives | Vendor extract format and server | Parquet in your S3 / GCS / Blob, readable by anything |
Identity, access, and evidence — designed in, not bolted on.
Notes on semantic layers, dashboards as documents, DuckDB extracts and migrating off Tableau.
Why a dashboard should be a JSON file you can diff, version and let an AI edit — and what that changes for a BI team.
Text-to-SQL fails on joins, metric drift and invented columns. A catalogue the model picks from fixes all three, and gives you column security for free.
The .hyper is the data; the XML is the migration. A walk through captions, calcs, shelves and zones — and what still needs a person.