Provenance gets filed under “nice to have” until the first time a number is wrong in public. Then it becomes the only thing anyone cares about, and the organisation discovers that the only record of how a figure was produced is a binary file and the memory of whoever built it — who may well have left.
This is a governance control, not a debugging feature. It deserves to be designed in.
The third row is the one that produced the audit finding, and it is the one most estates answer worst. Access set per workbook is a promise; three days of archaeology later nobody could evidence what the promise had been.
The three questions, and who normally has to answer them
| The question | In a typical estate | What it should take |
|---|---|---|
| Where did this number come from? | Open the workbook, find the sheet, read the calculated field. Assumes you have a licence, the file, and the skill. | One click, on the panel |
| What did it include and exclude? | Read the sheet filters, the dashboard filters, and the datasource filter. Three places, easy to miss one. | Shown with the query |
| Who was allowed to see this? | Check the permissions on the workbook, then on the project, then on the data source. Often nobody knows. | Named on the result |
The third question is the one auditors ask and the one estates answer worst. Access set per workbook is a promise; two reorganisations later nobody can say what the promise was.
xychart-beta horizontal
    title "Answering an auditor on one number, hours"
    x-axis ["Origin", "Inclusions", "Entitlement"]
    y-axis "Hours" 0 --> 18
    bar [16, 8, 0]
What a panel can tell you about itself
Every panel on every dashboard in InsightViz carries its own working. Not a log somewhere else — on the panel, one click away, for anyone who can see the panel at all.
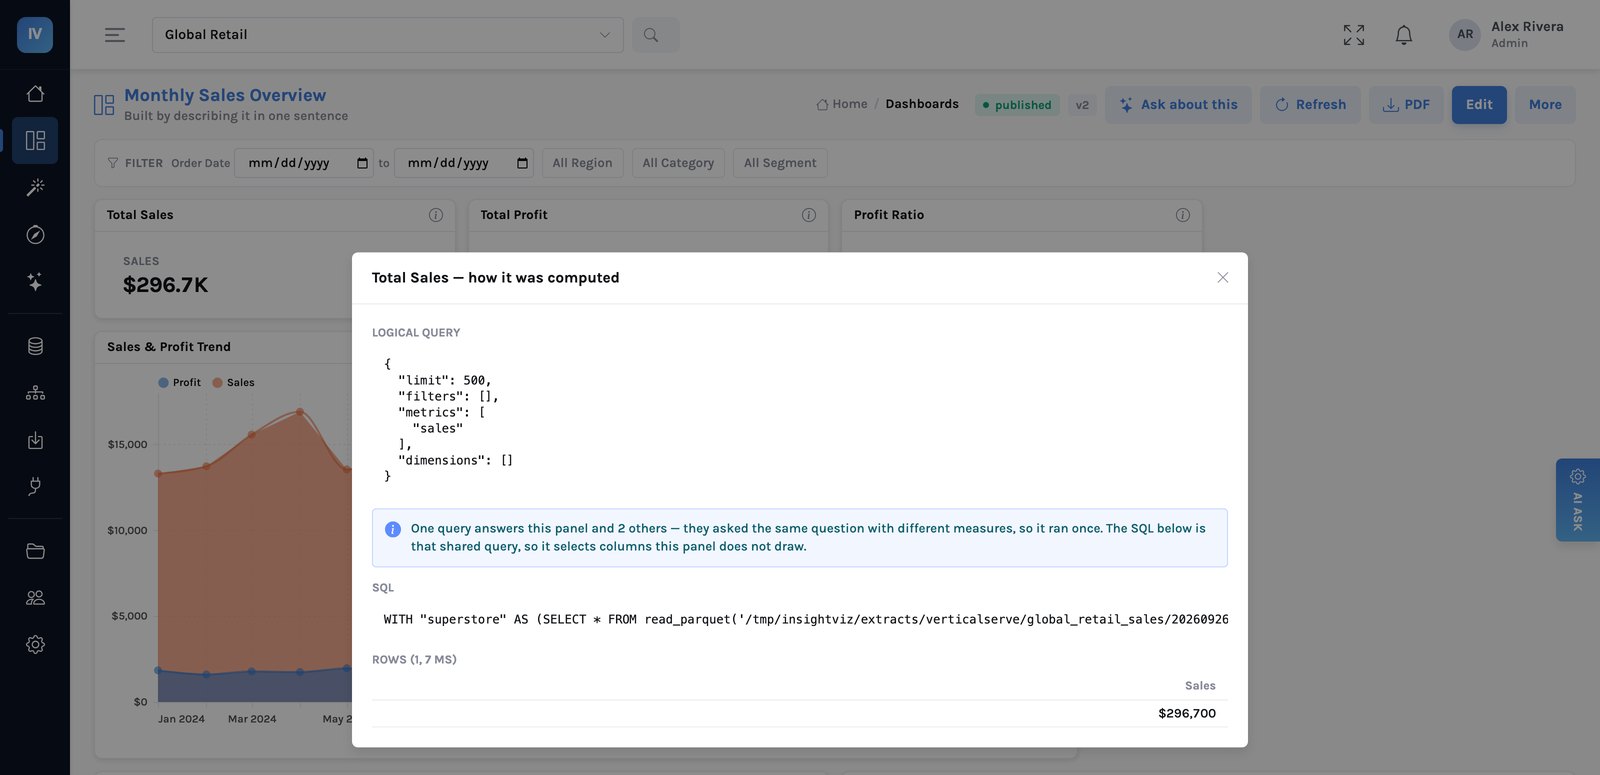
The logical query is the part that matters for a business audience. metrics: ["sales"],
filters: [], dimensions: [] — a finance lead can read that
and confirm it is the whole book of business with nothing excluded. They do not need to
read SQL, and they do not need to trust that someone else read it correctly.
Why the SQL is shown as well
Because the logical query is a promise and the SQL is the evidence. Anyone who wants to verify that the promise was kept — an auditor, a sceptical analyst, a data engineer — can read the statement that actually ran against the data, including the clauses your access policies put there.
Access rules that live on the data, not the file
The reason the third question is answerable is that access is not set per dashboard. It is set once on the datasource and applied on every path to the data — a dashboard, an exploration, an export, an AI answer.
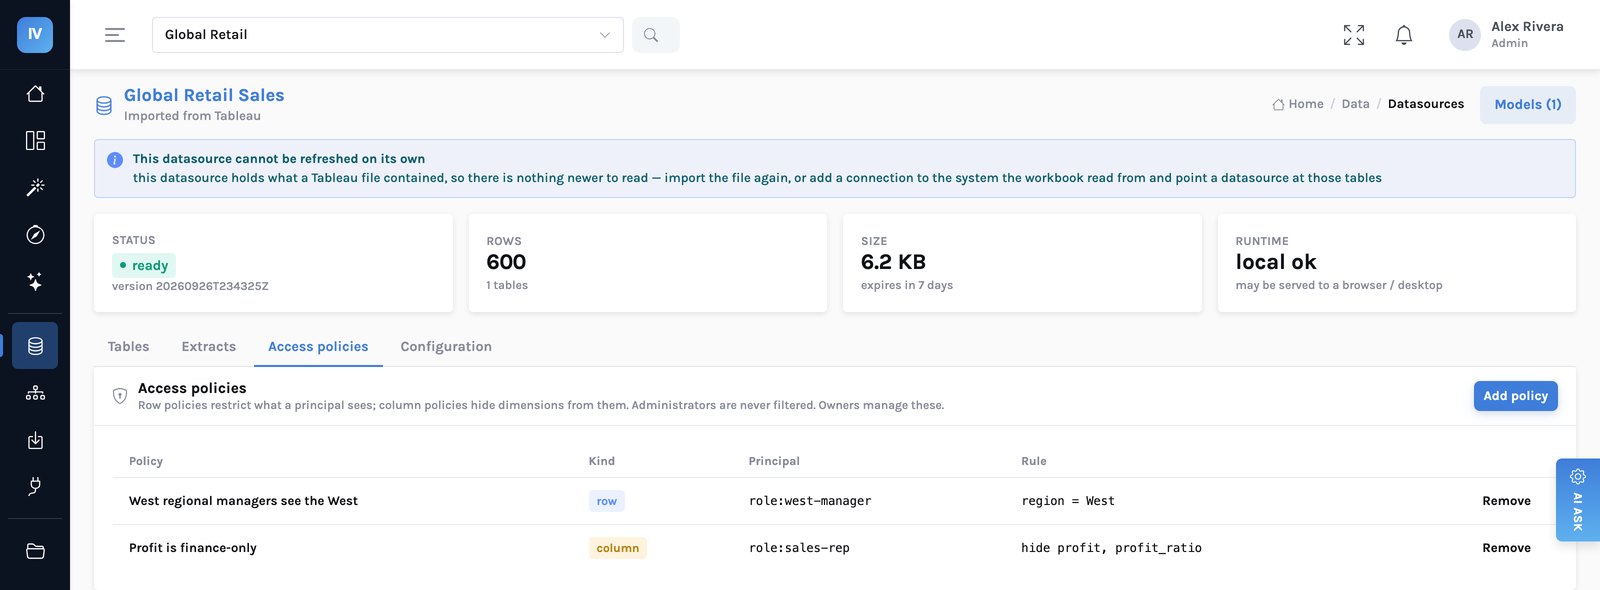
The distinction between the two matters more than it first appears. Hiding a column in the interface leaves it reachable by anyone who can construct a query. Removing it from the vocabulary means there is no query to construct: the field does not exist for that person, in any surface, including the assistant.
flowchart LR
    U1["An analyst
in Explore"] --> G
    U2["A manager reading
a dashboard"] --> G
    U3["Anyone asking
in plain words"] --> G
    U4["A scheduled
export"] --> G
    G{"One policy gate
row rules + column rules"} --> E["The engine"]
    E --> L["Audit log
answers and refusals"]
    style G fill:#fff4e6,stroke:#f0cb9a
    style L fill:#eef1ff,stroke:#c7cdf2
Refusals are the part auditors ask about
Most audit trails record what people saw. The more useful record is what they were stopped from seeing — that is the evidence that a control was live rather than merely configured.
The query log records every question: who asked, from where, how many rows came back, how long it took, and whether it was refused and why. A request for a column someone is not entitled to does not silently return nothing; it is refused, named, and written down.
A control that has never visibly stopped anything is indistinguishable from a control that is switched off.
Versions, so “it changed” is answerable too
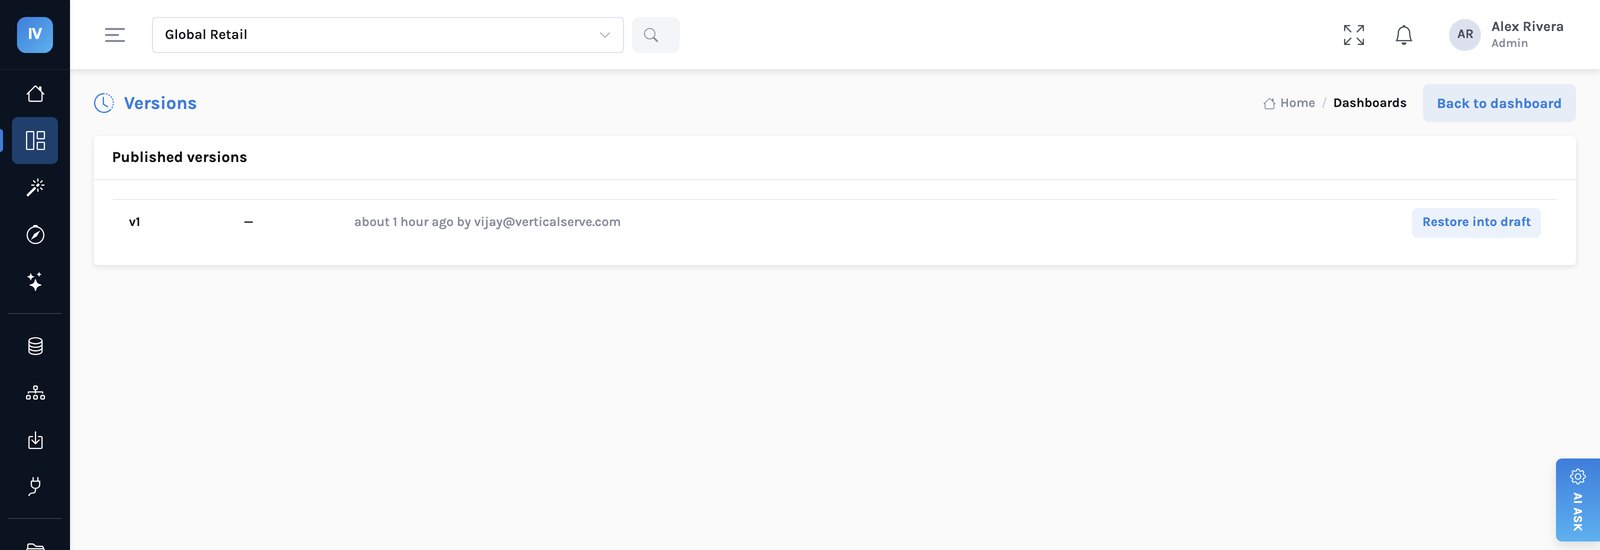
Provenance covers one number at one moment. The other half of the question is what changed between last quarter's pack and this one. A dashboard here is a readable document, and publishing records a version with a note.
And now: why it changed
Everything above answers where did this number come from. The question that follows it in every meeting is why did it move, and until recently the honest answer was “ask an analyst”. The dashboard now answers it itself. Press Why? on a panel and it picks the period that moved and the one to compare with, runs its own question broken down by every business dimension in both periods — through the same compiler, under the same access rules — and works out what drove the change.
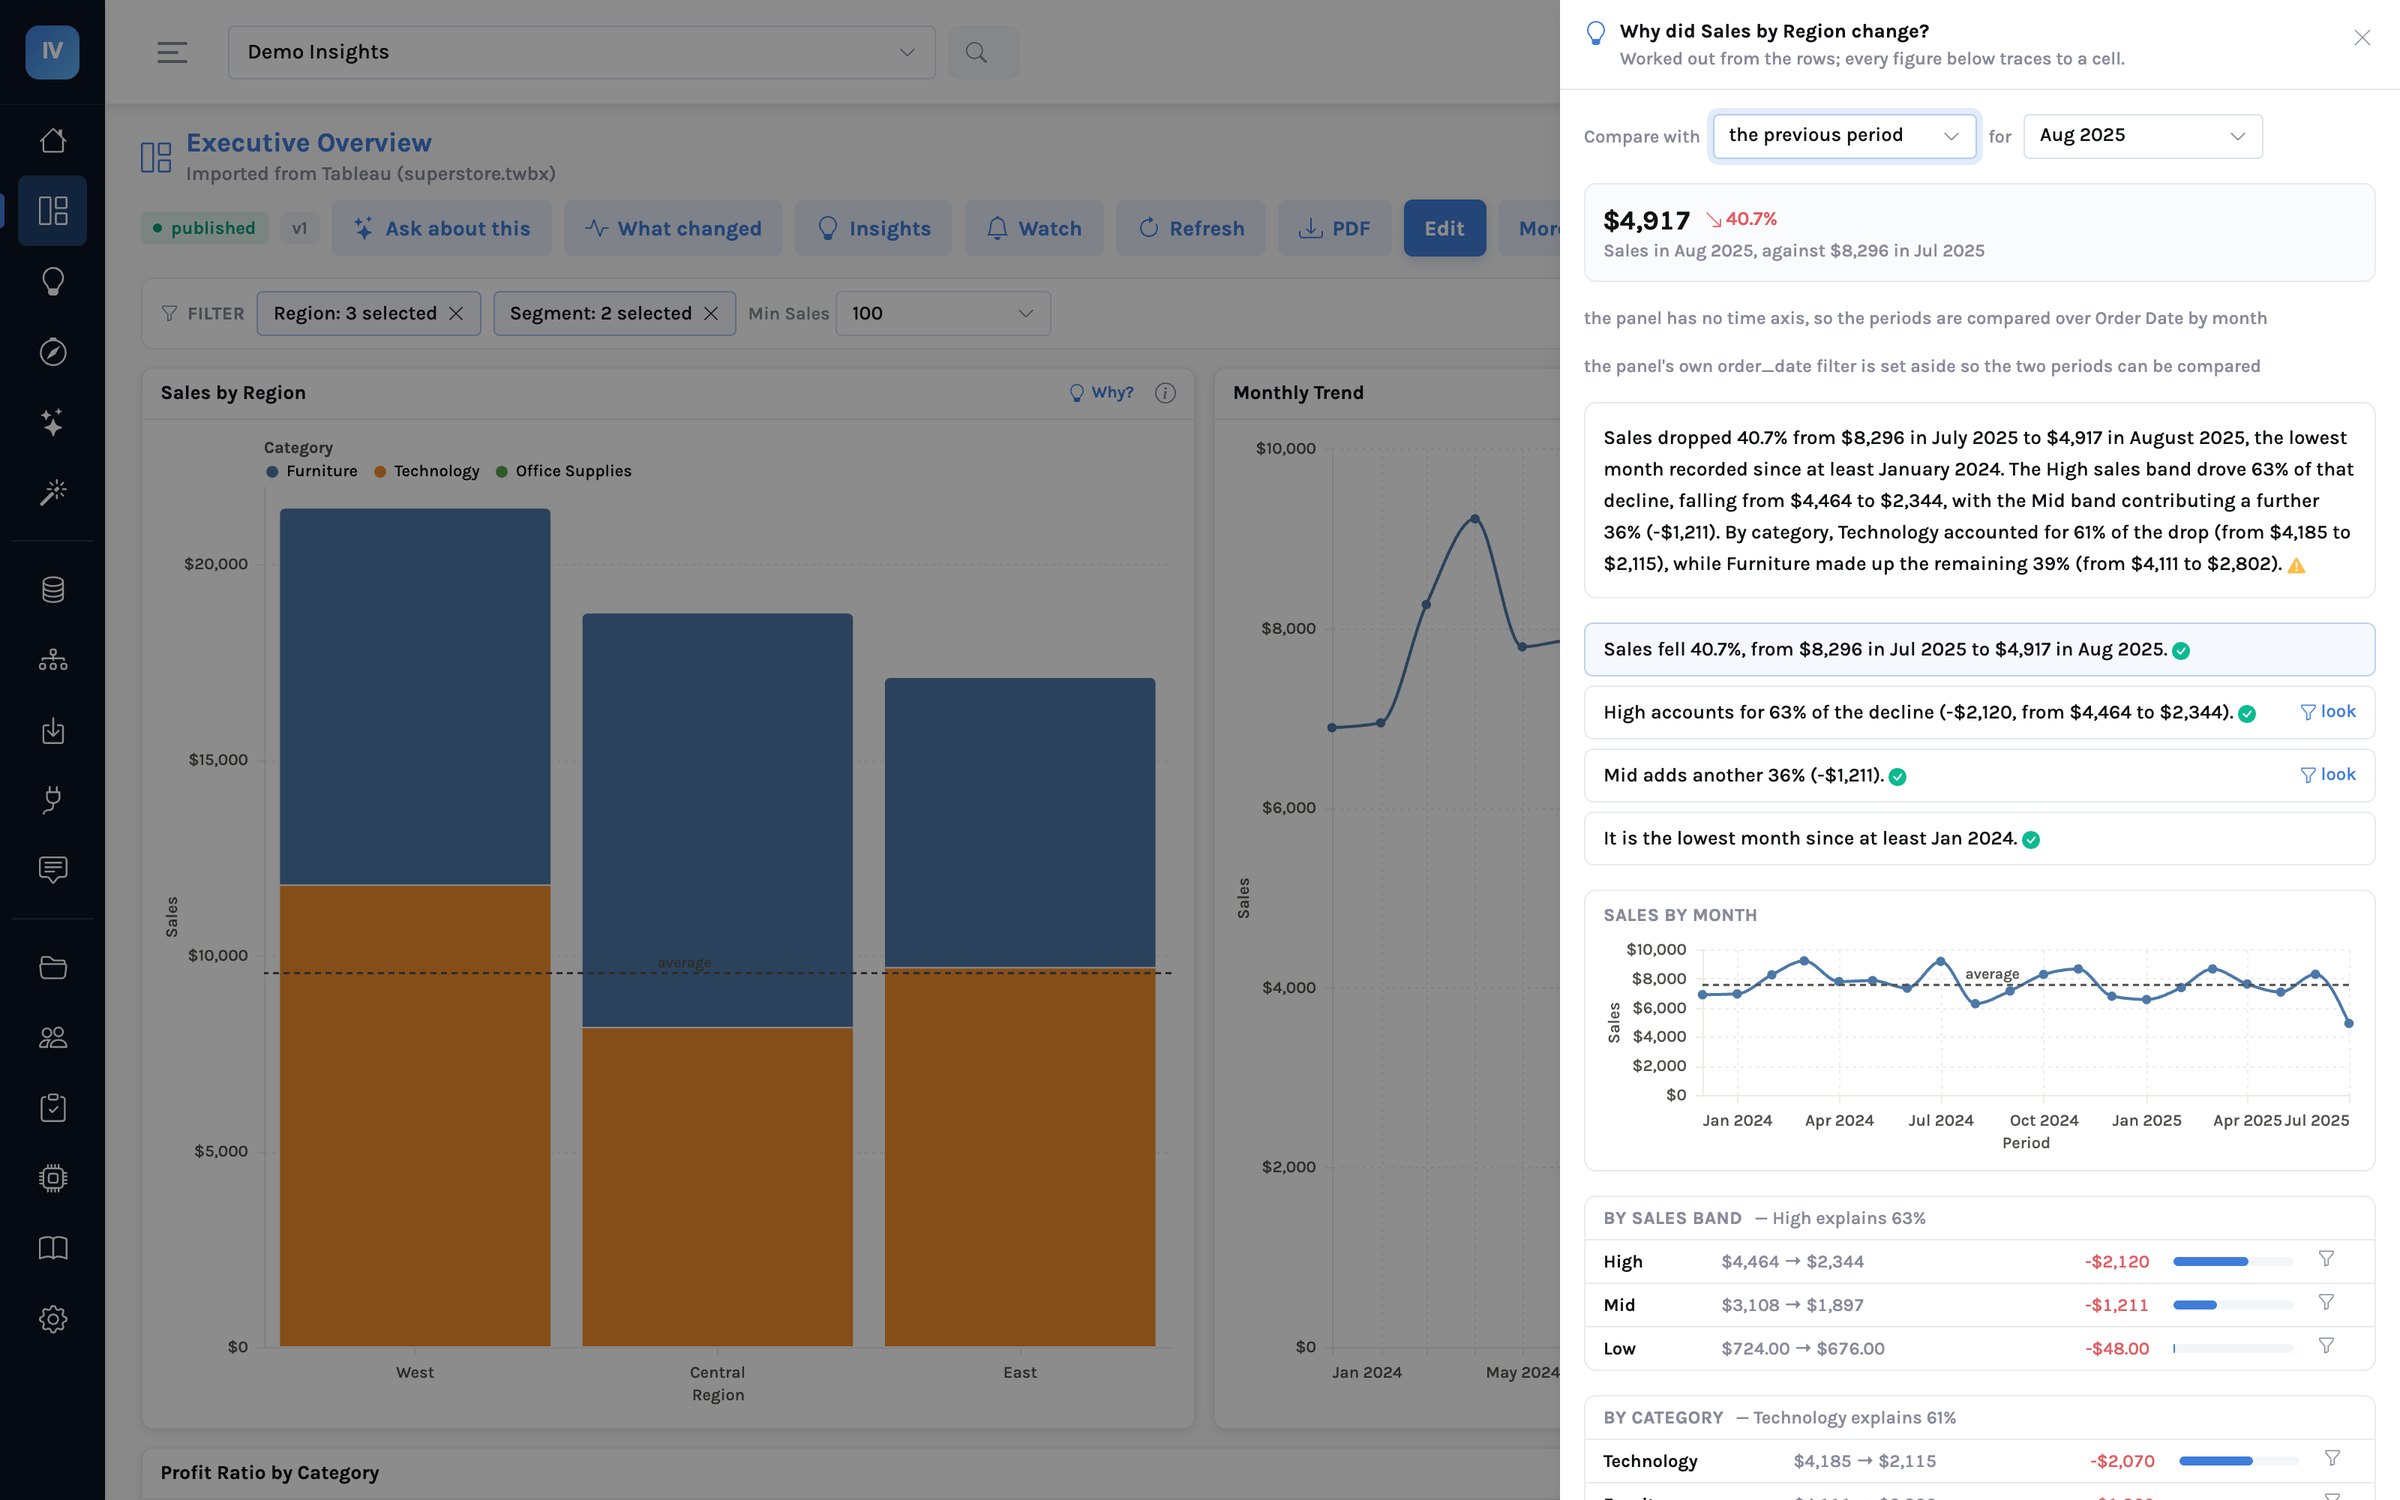
It is provenance applied to a sentence rather than a number: a claim is only made when a row supports it, a model’s summary is checked figure by figure before it is shown, and a summary that fails the check is dropped with a note. The three questions in this post — what does it mean, what did it include, who could see it — now have a fourth beside them, answered the same way. The worked example →
What this does not give you
Two limits worth being clear about, because provenance is easy to oversell.
- It answers “where did this come from”, not “is this right”. The system can show you that the number is the sum of the sales column with no filters. Whether the sales column is the right basis for the decision is a business judgement, and no amount of lineage supplies it.
- It stops at the datasource boundary. You get full fidelity from the governed copy forward. If the upstream pipeline that fed it applied a transformation nobody documented, that is still your problem — it is simply a smaller and better-defined problem than before.
And then it keeps the question
An explanation answers one question, once. Kept as an insight, the same question becomes a story — several governed parts, written up, every figure matched to the row it came from — that re-runs at the reader’s filters. The check that matters for this post is at publish: a story whose figures did not all trace is refused, or published with an untraced mark on the version that everyone who opens it can see. The question “where did this number come from” then has an answer on every sentence, not just on every panel. How that reaches people before the meeting.
The test to run on your own estate
Pick a number from your most recent board pack. Time how long it takes someone who did not build it to establish: the definition behind it, the filters that applied, and who could have seen it. If the answer is longer than a meeting, you do not have a provenance problem — you have a governance one, and it will surface on someone else's schedule.
The full business case → · Why the definition drifted in the first place →