Ask a finance team what month-end actually involves and the answer is rarely “running reports”. It is chasing, reconciling, rebuilding, and then formatting. The reports exist. They are simply not trusted enough to paste straight into a pack the board will read.
That distrust is rational. Let us follow one close in detail, because the cost is in the specifics rather than in the summary.
Eleven days, and the part that actually cost the business was the last line. The decision that meeting was convened to make — whether to extend click-and-collect to the remaining twelve stores — was deferred four weeks because a definition could not be confirmed in the room.
Finance does not rebuild dashboard numbers out of diligence. It rebuilds them because it cannot see how they were defined, and it knows it will be asked.
Where the eleven days actually go
| Activity | Days | Is it finance work? | What removes it |
|---|---|---|---|
| Waiting for feeds to land | 3 | No — it is coordination | A visible refresh schedule per source, so “is this final?” has an answer on the page |
| Rebuilding existing figures | 3 | No | A definition anyone can read without opening a file |
| Reconciling with commercial | 2 | No — it is drift | One definition of net revenue, used by both packs |
| Formatting | 3 | Partly | Export sized to the dashboard, and live figures rather than screenshots |
| Analysis and commentary | 0 | Yes — and it gets none | — |
The last row is the finding. In a typical close, the only genuinely finance-skilled activity in the list gets whatever is left over, which is usually the evening before.
sankey-beta
Eleven days,Waiting and chasing,3
Eleven days,Rebuilding figures,3
Eleven days,Reconciling,2
Eleven days,Formatting,3
Eleven days,Analysis,0
Three things have to be true for a figure to go in a pack
- It is current — easy, and where most tools stop.
- The definition is knowable by the presenter, in the meeting, without opening a file or calling anyone.
- It is the agreed definition — the same one commercial's pack used.
Points two and three are what the remaining eight days are buying, badly.
The same close, after
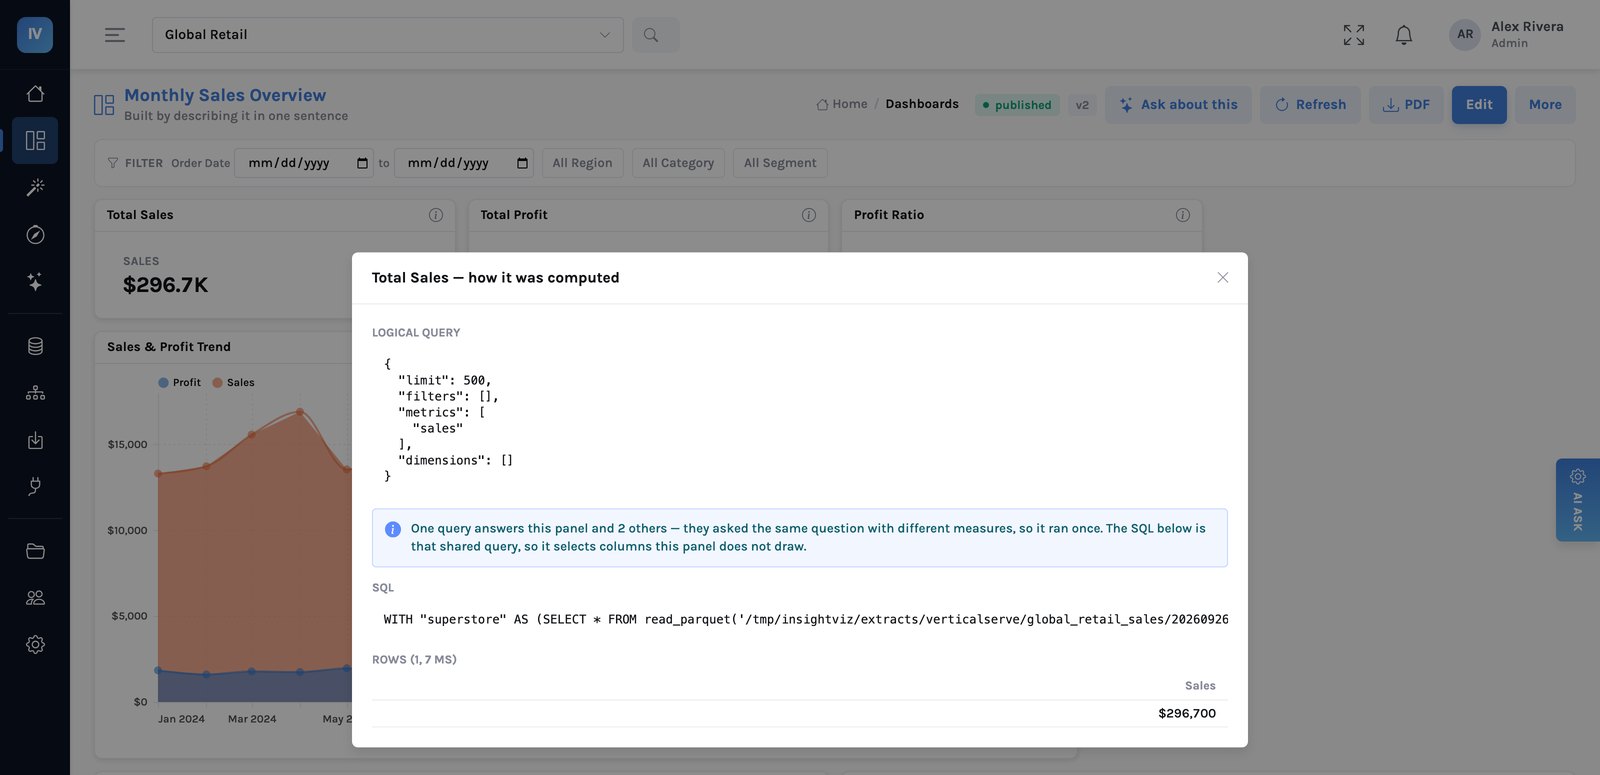
metrics: ["sales"], filters: [], dimensions: [] — the whole book of business, nothing excluded. Priya can confirm that in five seconds, in the meeting, without reading SQL.The four days are not the point. The twenty seconds are. A decision made in the meeting it was convened for is worth considerably more than three FTE-days a month, and it is the benefit that never appears in a business case because nobody measures deferred decisions.
What actually did the work
One definition, with an owner
The reconciliation disappeared because there is one net revenue rather than three. Not a reconciliation step at the end — a shared definition at the start.
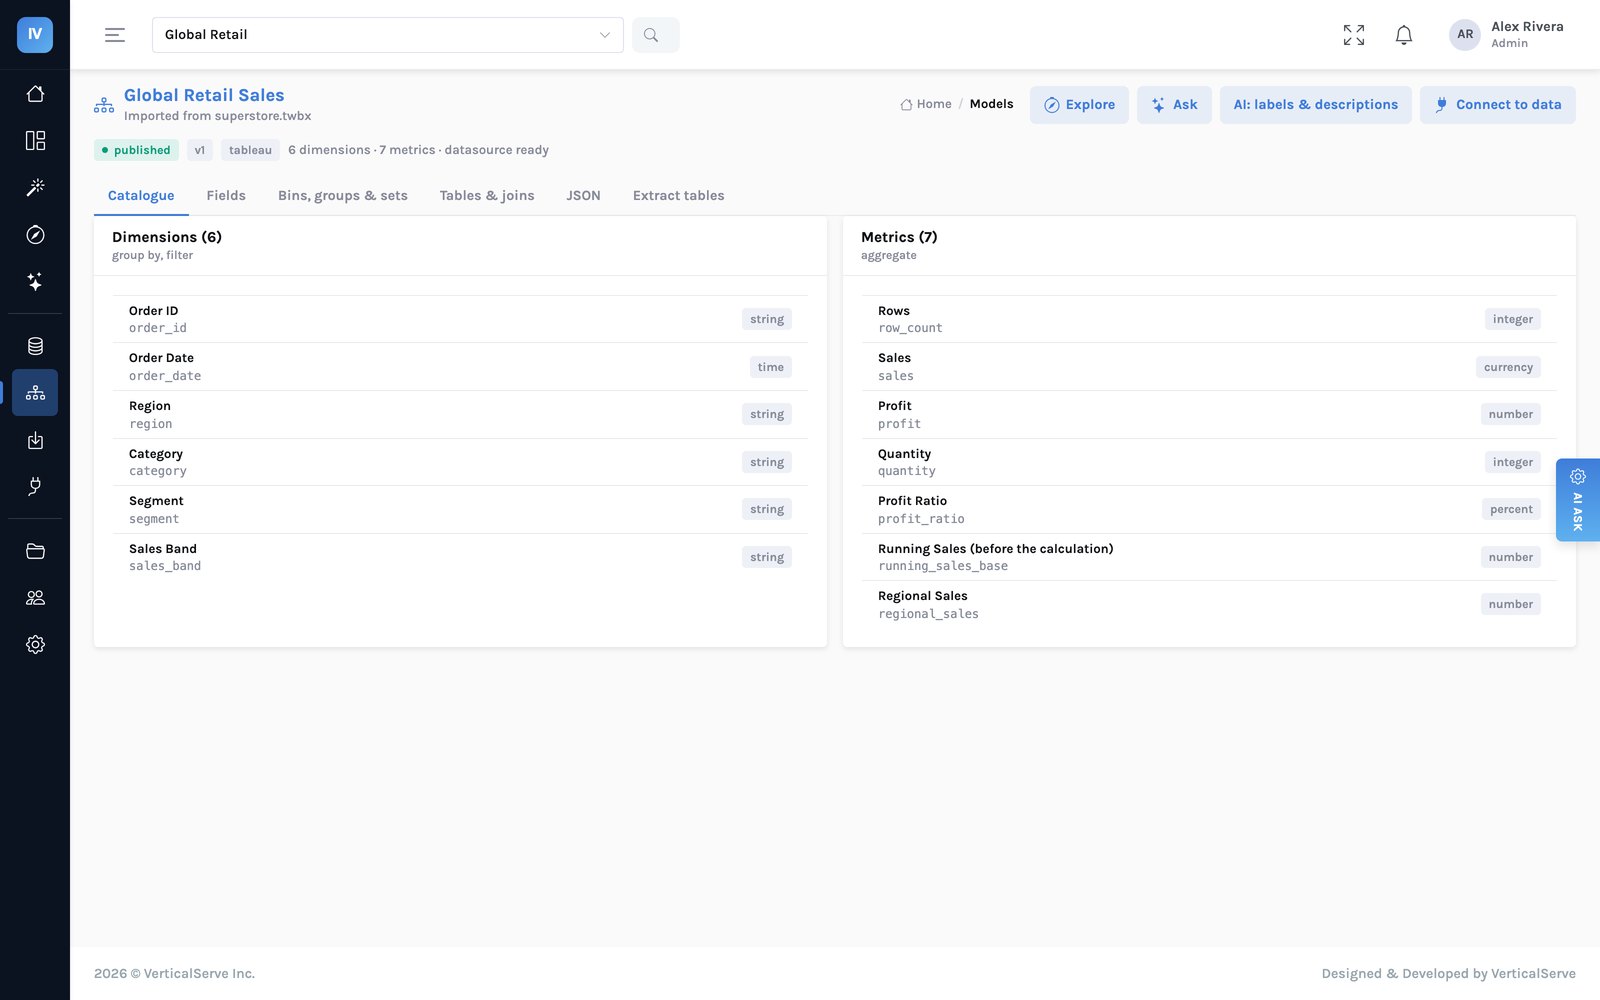
Net revenue exists because somebody typed a formula into a calculated field in 2019. Every copy of that workbook is equally authoritative, and changing one changes one dashboard.
A named metric with a description and a person responsible. Every dashboard references it rather than restating it. Change it once and the estate follows.
The uncomfortable part, stated plainly
Putting the definitions in one place makes the disagreements visible; it does not resolve them. Somebody still had to decide whether net revenue excludes intercompany, and that decision moved the distribution centre’s reported contribution. It took Priya three meetings. The gain is that it happened once, deliberately, rather than every quarter by accident in front of the board.
Every figure carries its working
Any panel will show the question it asked, the query that ran, and the access rules that applied. Not in a lineage tool someone else administers — on the panel, for anyone who can see the panel at all. That is what turned a deferred decision into a twenty-second answer.
The pack is a page, not a screenshot
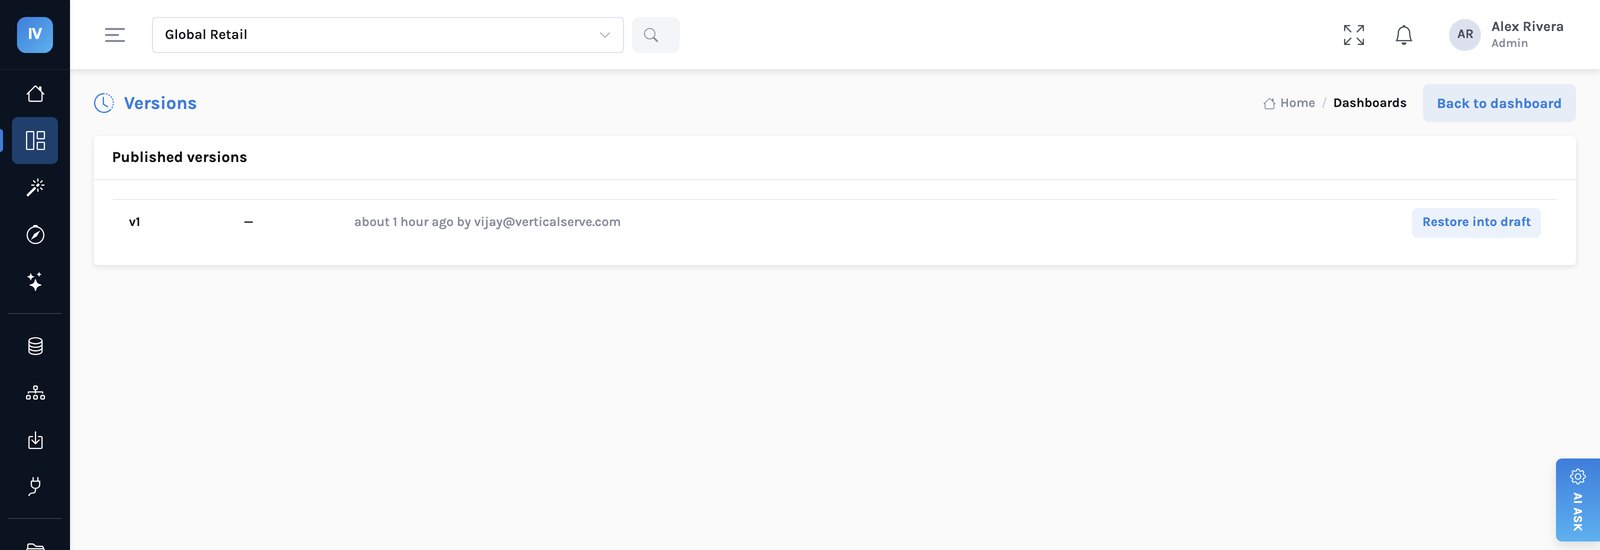
A dashboard exports as PDF or an image, sized to the dashboard rather than paginated onto A4, so a wide regional chart is not cut down the middle. And because publishing records a version with a note, “what changed since last month's pack” is answerable — a question currently answered by memory in most finance functions.
The question in the meeting, before the meeting
The one question nobody could answer on the spot — why is that number down — is now answered before the pack is opened. The scheduled delivery that sends the pack carries a digest in the body of the email: each panel’s latest period against the one before, ranked by how much it moved, with the driver under each line. In the console the same digest is What changed on every dashboard, and Why? on every chart opens the working.
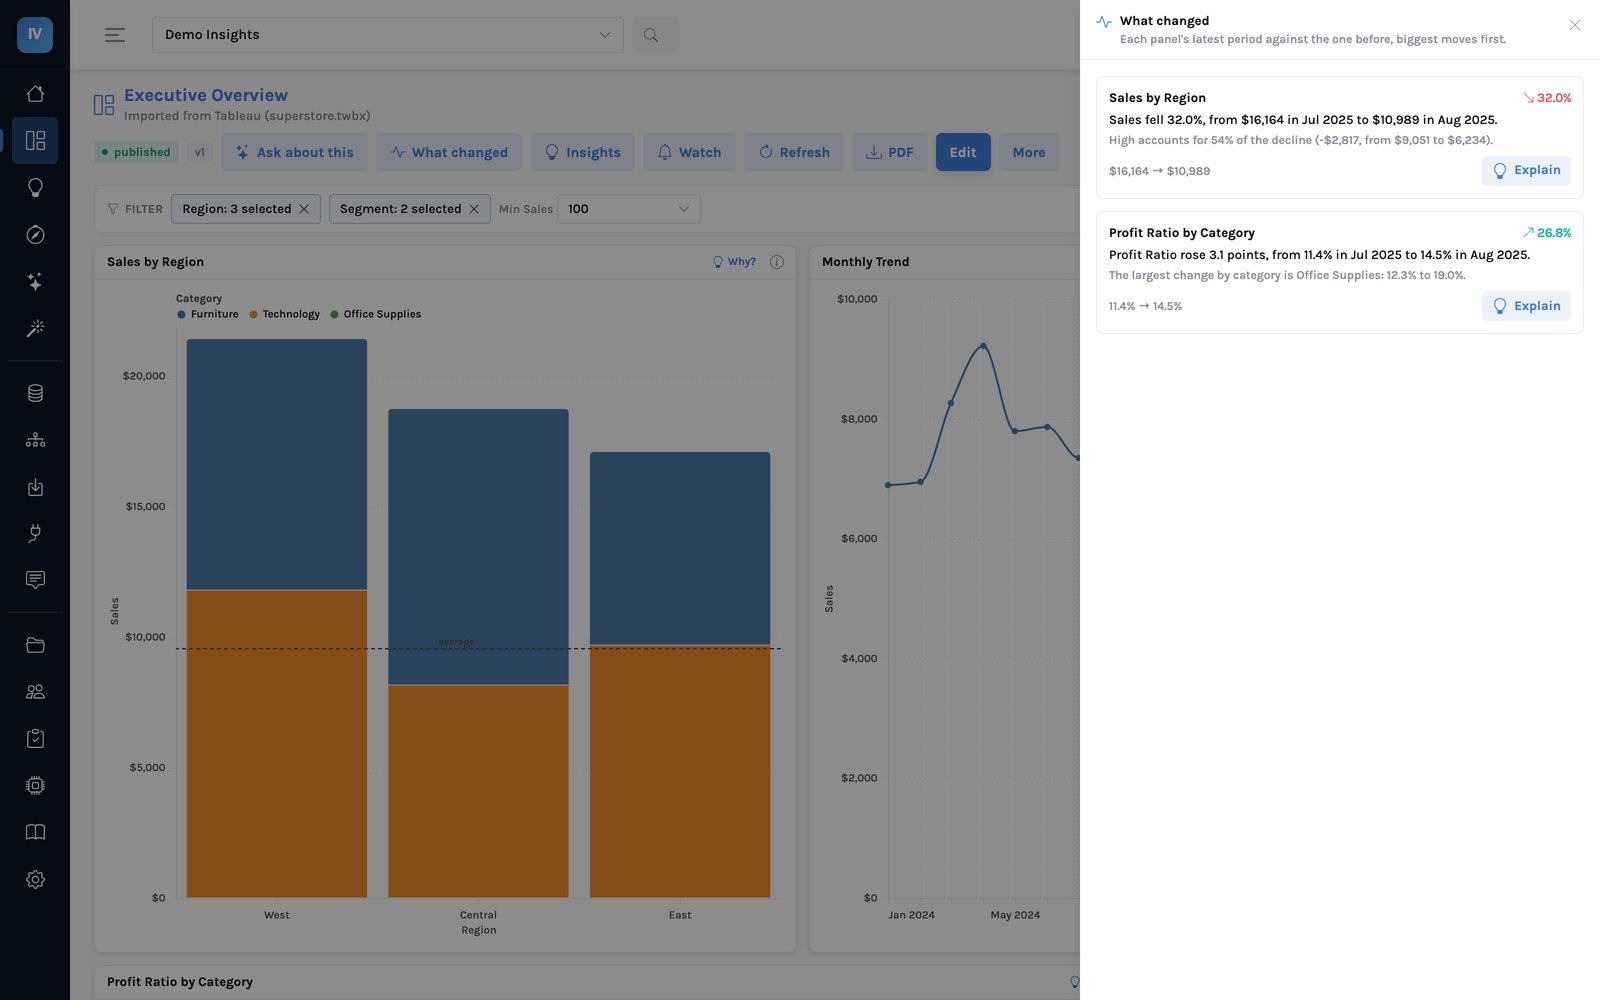
Every sentence in it is computed from the rows and checked figure by figure — the same standard the pack itself now meets. What it will not do is name a cause the data does not contain; when a question needs one, it says so and names what would answer it, which is the answer a CFO would rather have than a plausible one. How the explanation is built →
What this does not fix
- It does not close your books. This is reporting on data already produced. If the ledger closes late, the pack is late. Priya's three chasing days shrink because the status is visible, not because the feeds arrive sooner.
- It does not decide whether the metric is right. Provenance answers “where did this come from”, never “is this the right basis for the decision”.
- It stops at the datasource boundary. If a transformation upstream merged click-and-collect into store sales before the data arrived, no downstream definition un-merges it.
- The first set of definitions will be wrong. Expect two revisions in the first quarter. That is the process working.
The test, on your own last pack
- Take the three figures most likely to be challenged. Time how long it takes someone who did not build them to state the definition, the filters and who could see it. Longer than a meeting is the gap.
- Count the distinct definitions of your top five metrics across finance, commercial and operations. The number is usually worse than the guess, and it is your actual project plan.
- Count the deferred items in the last four sets of board minutes that were deferred for want of a number. That is the cost nobody has put on a slide.
Why the definitions disagree → · Provenance as a governance control →