Every BI estate is designed for the person who builds dashboards and used by the person who reads them. Those are not the same job, they are not the same skill, and the second group outnumbers the first by roughly ten to one.
They are also, often, the people best placed to act. Watch one for four minutes.
Two of his seven instincts were supported. He went into the call without the answer, the analyst spent forty minutes on Wednesday on a question that had stopped mattering on Monday, and nine stores ran another week before anyone looked at furniture.
A dashboard that cannot answer the second question is a picture, not a tool. The second question is always “why?”
What he was actually trying to do
| What he did | What he was asking | Supported? |
|---|---|---|
| Opened the dashboard | Is anything wrong? | Yes |
| Filtered to his region | Is anything wrong here? | Yes |
| Clicked the bad bar | Which category is dragging it? | No |
| Clicked again, deeper | Which product? | No |
| Compared with last week | Is this new, or has it been like this? | No |
| Asked a person | — | Two days later |
| Screenshotted it | Show three people the thing | Undated, unfiltered |
None of those are exotic. They are the obvious next questions anyone looking at a chart would ask, and they fail in the same order in most estates.
The same four minutes
He did not learn a tool. He clicked things that looked clickable and they did what he expected. That is the entire design goal for this persona.
What made each step work
Filters that read like the business
The controls come from the business dimensions — Region, Category, Segment — not from column names. On an imported dashboard they arrive with the selections the original workbook had, so nobody has to be told which filters matter.
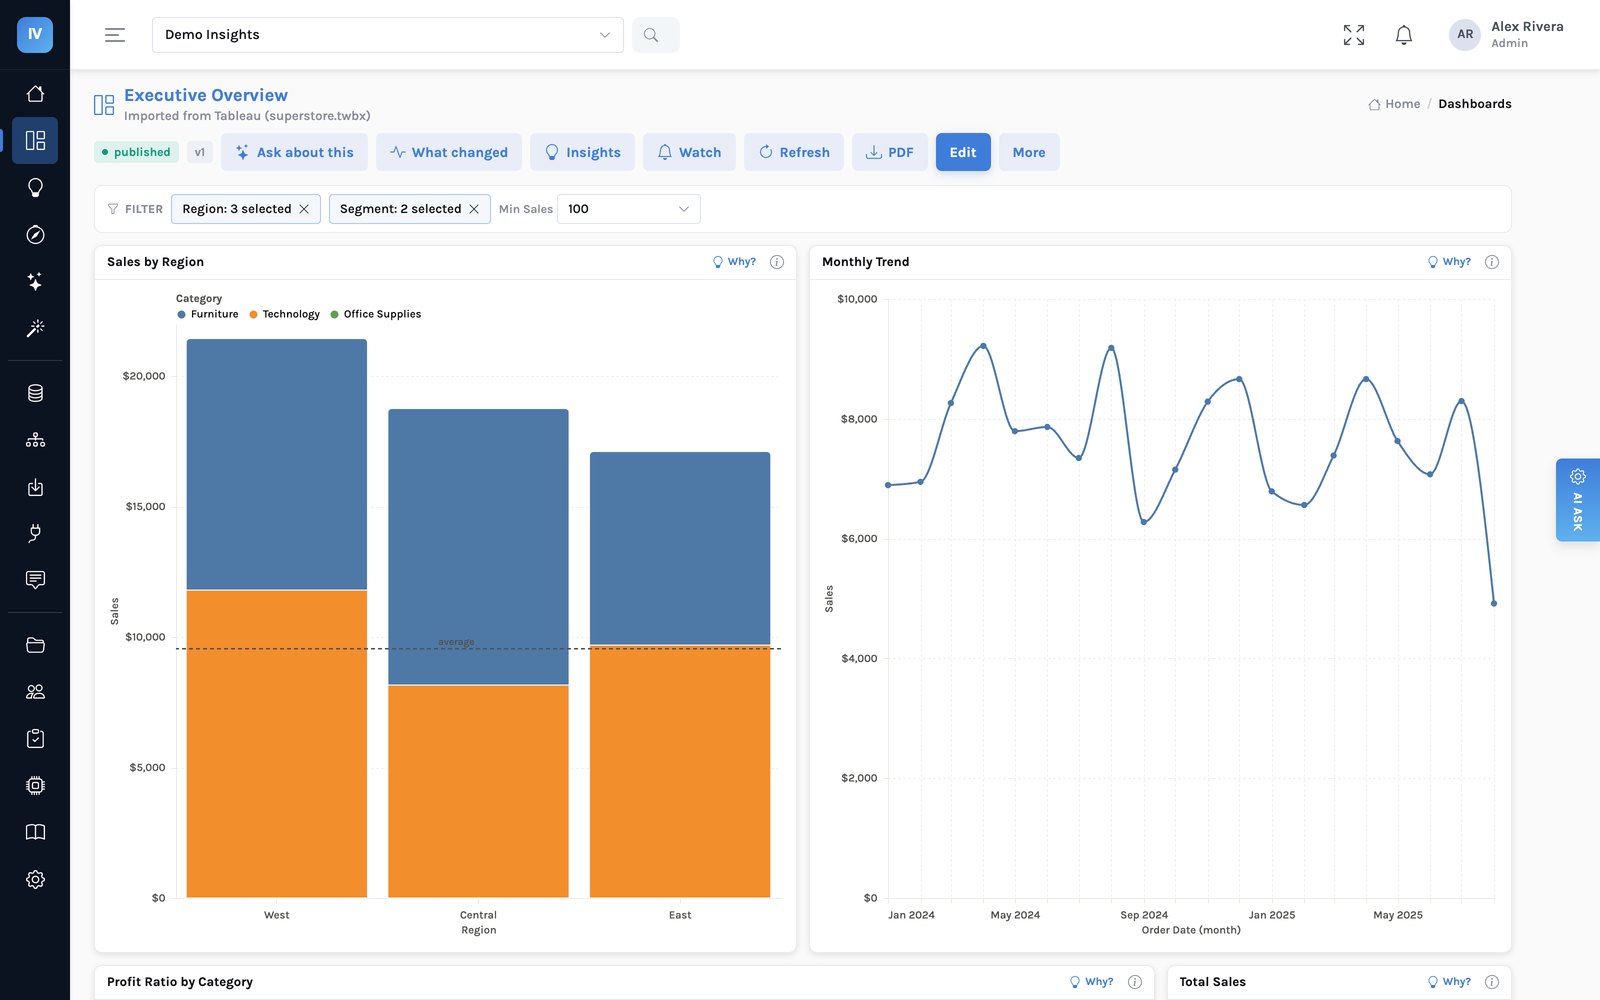
Click, then click again
Clicking a mark filters the rest of the page — the behaviour every other interface has trained him to expect. Clicking again goes a level deeper. The server works out which level that lands on from the model's own hierarchies.
flowchart LR
    A["Sales by region"] -->|"click Central"| B["By category
Central only"]
    B -->|"click Furniture"| C["By product
Furniture, Central"]
    C -->|"click again"| D["No level below product
— and it says so"]
    style D fill:#fff4e6,stroke:#f0cb9a
Why the level is decided on the server
Because a manager restricted to one region must not be able to drill into another, and because “nothing happened” is the worst possible response to a click. The server knows both the hierarchy and the person’s access rules, so it returns the next level or an honest explanation of why there is not one.
Only his own rows, without being told
Marcus is restricted to Central. He sees Central numbers everywhere — dashboard, export, assistant — and the restriction is part of the query rather than a filter over results, so his totals are genuinely his region's rather than a national total with rows hidden.
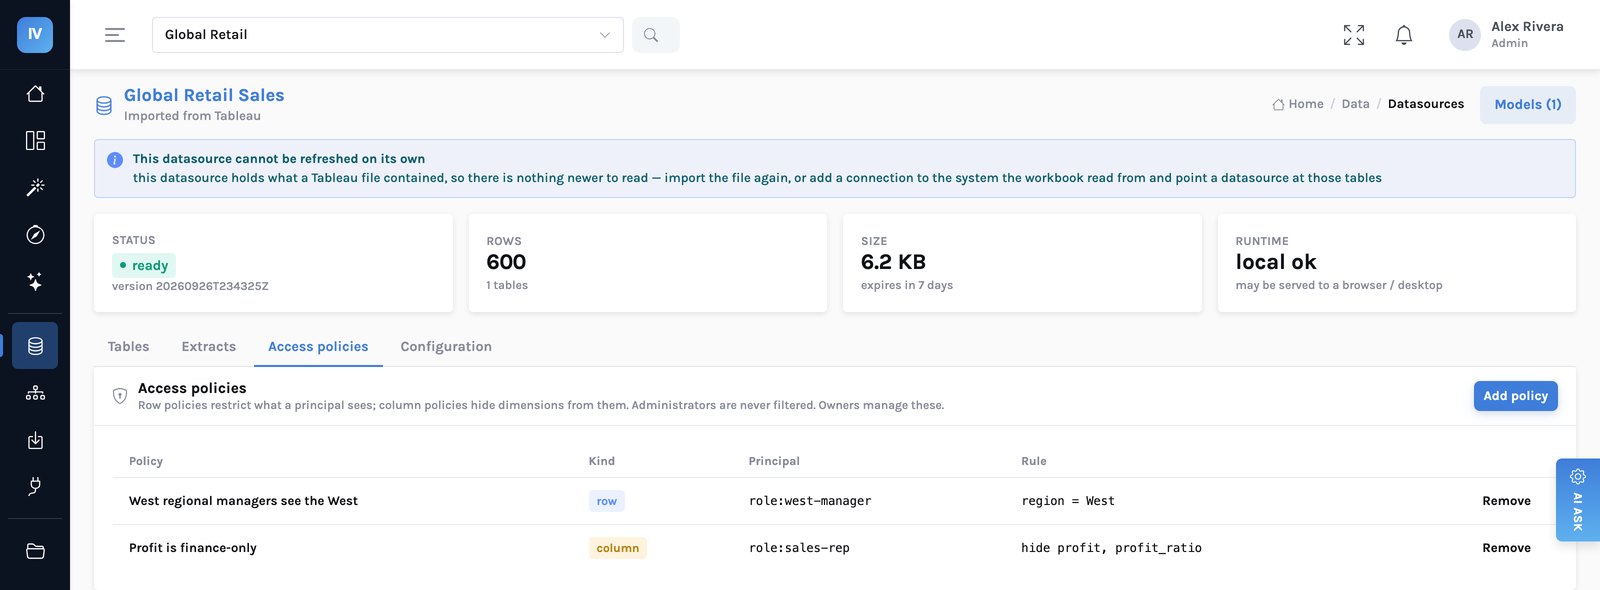
The question the page does not answer
His 1:10 question — was it stock or price? — is not on any dashboard and never will be. It is the kind of question that only occurs to someone looking at a specific number on a specific Monday.
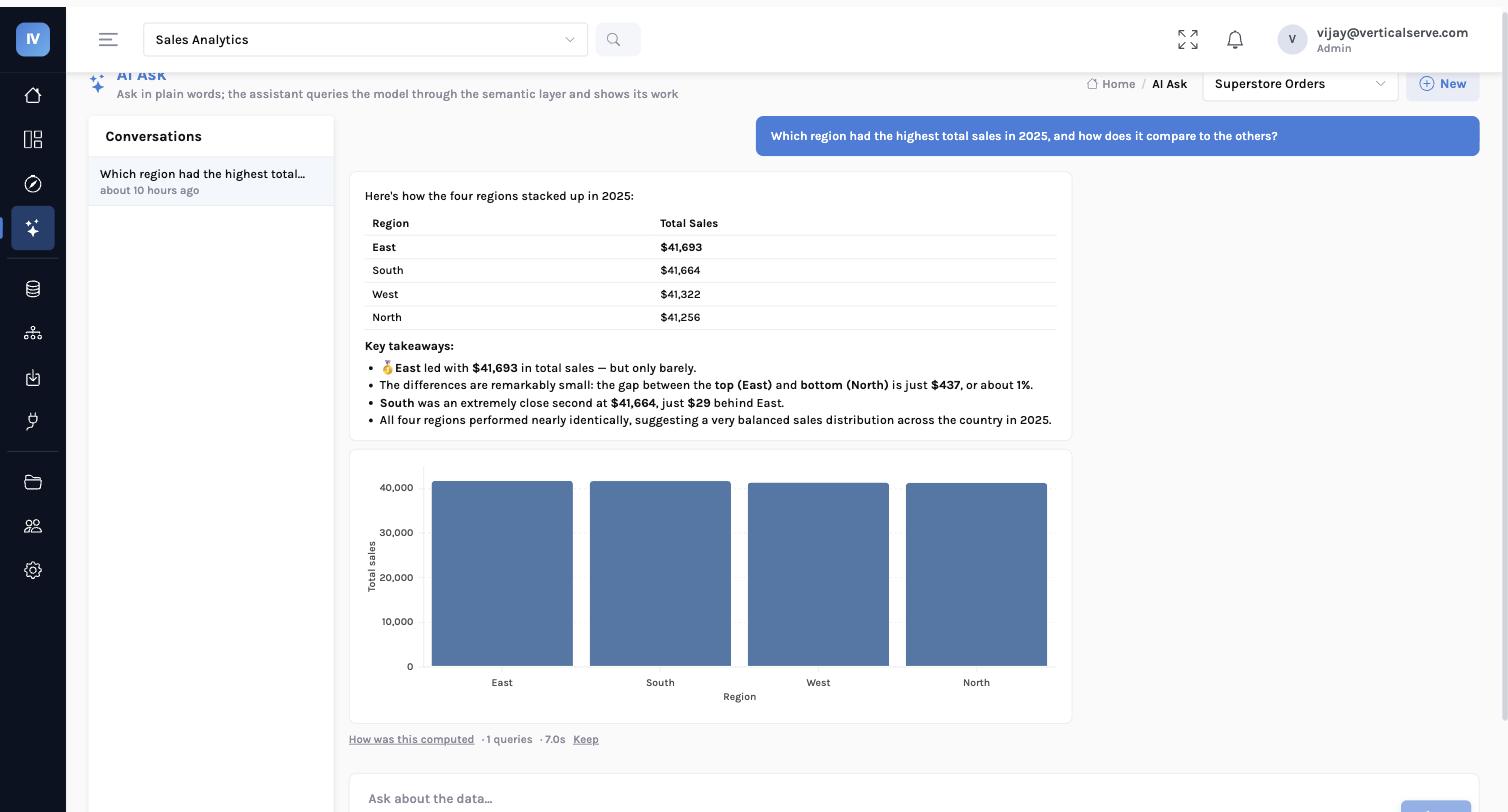
The Monday question, answered on the chart
The seventh instinct in the session above — why — was the one the tool could not take. It can now. The sales chart has a Why? button; he presses it and the panel says, in four sentences he can read in the lift, how much sales fell, which band or category carried the fall, what moved the other way, and whether this is the lowest month in the series. Under it: look at High on its own, break High down by category, alert me if it falls below this again — each one a click.
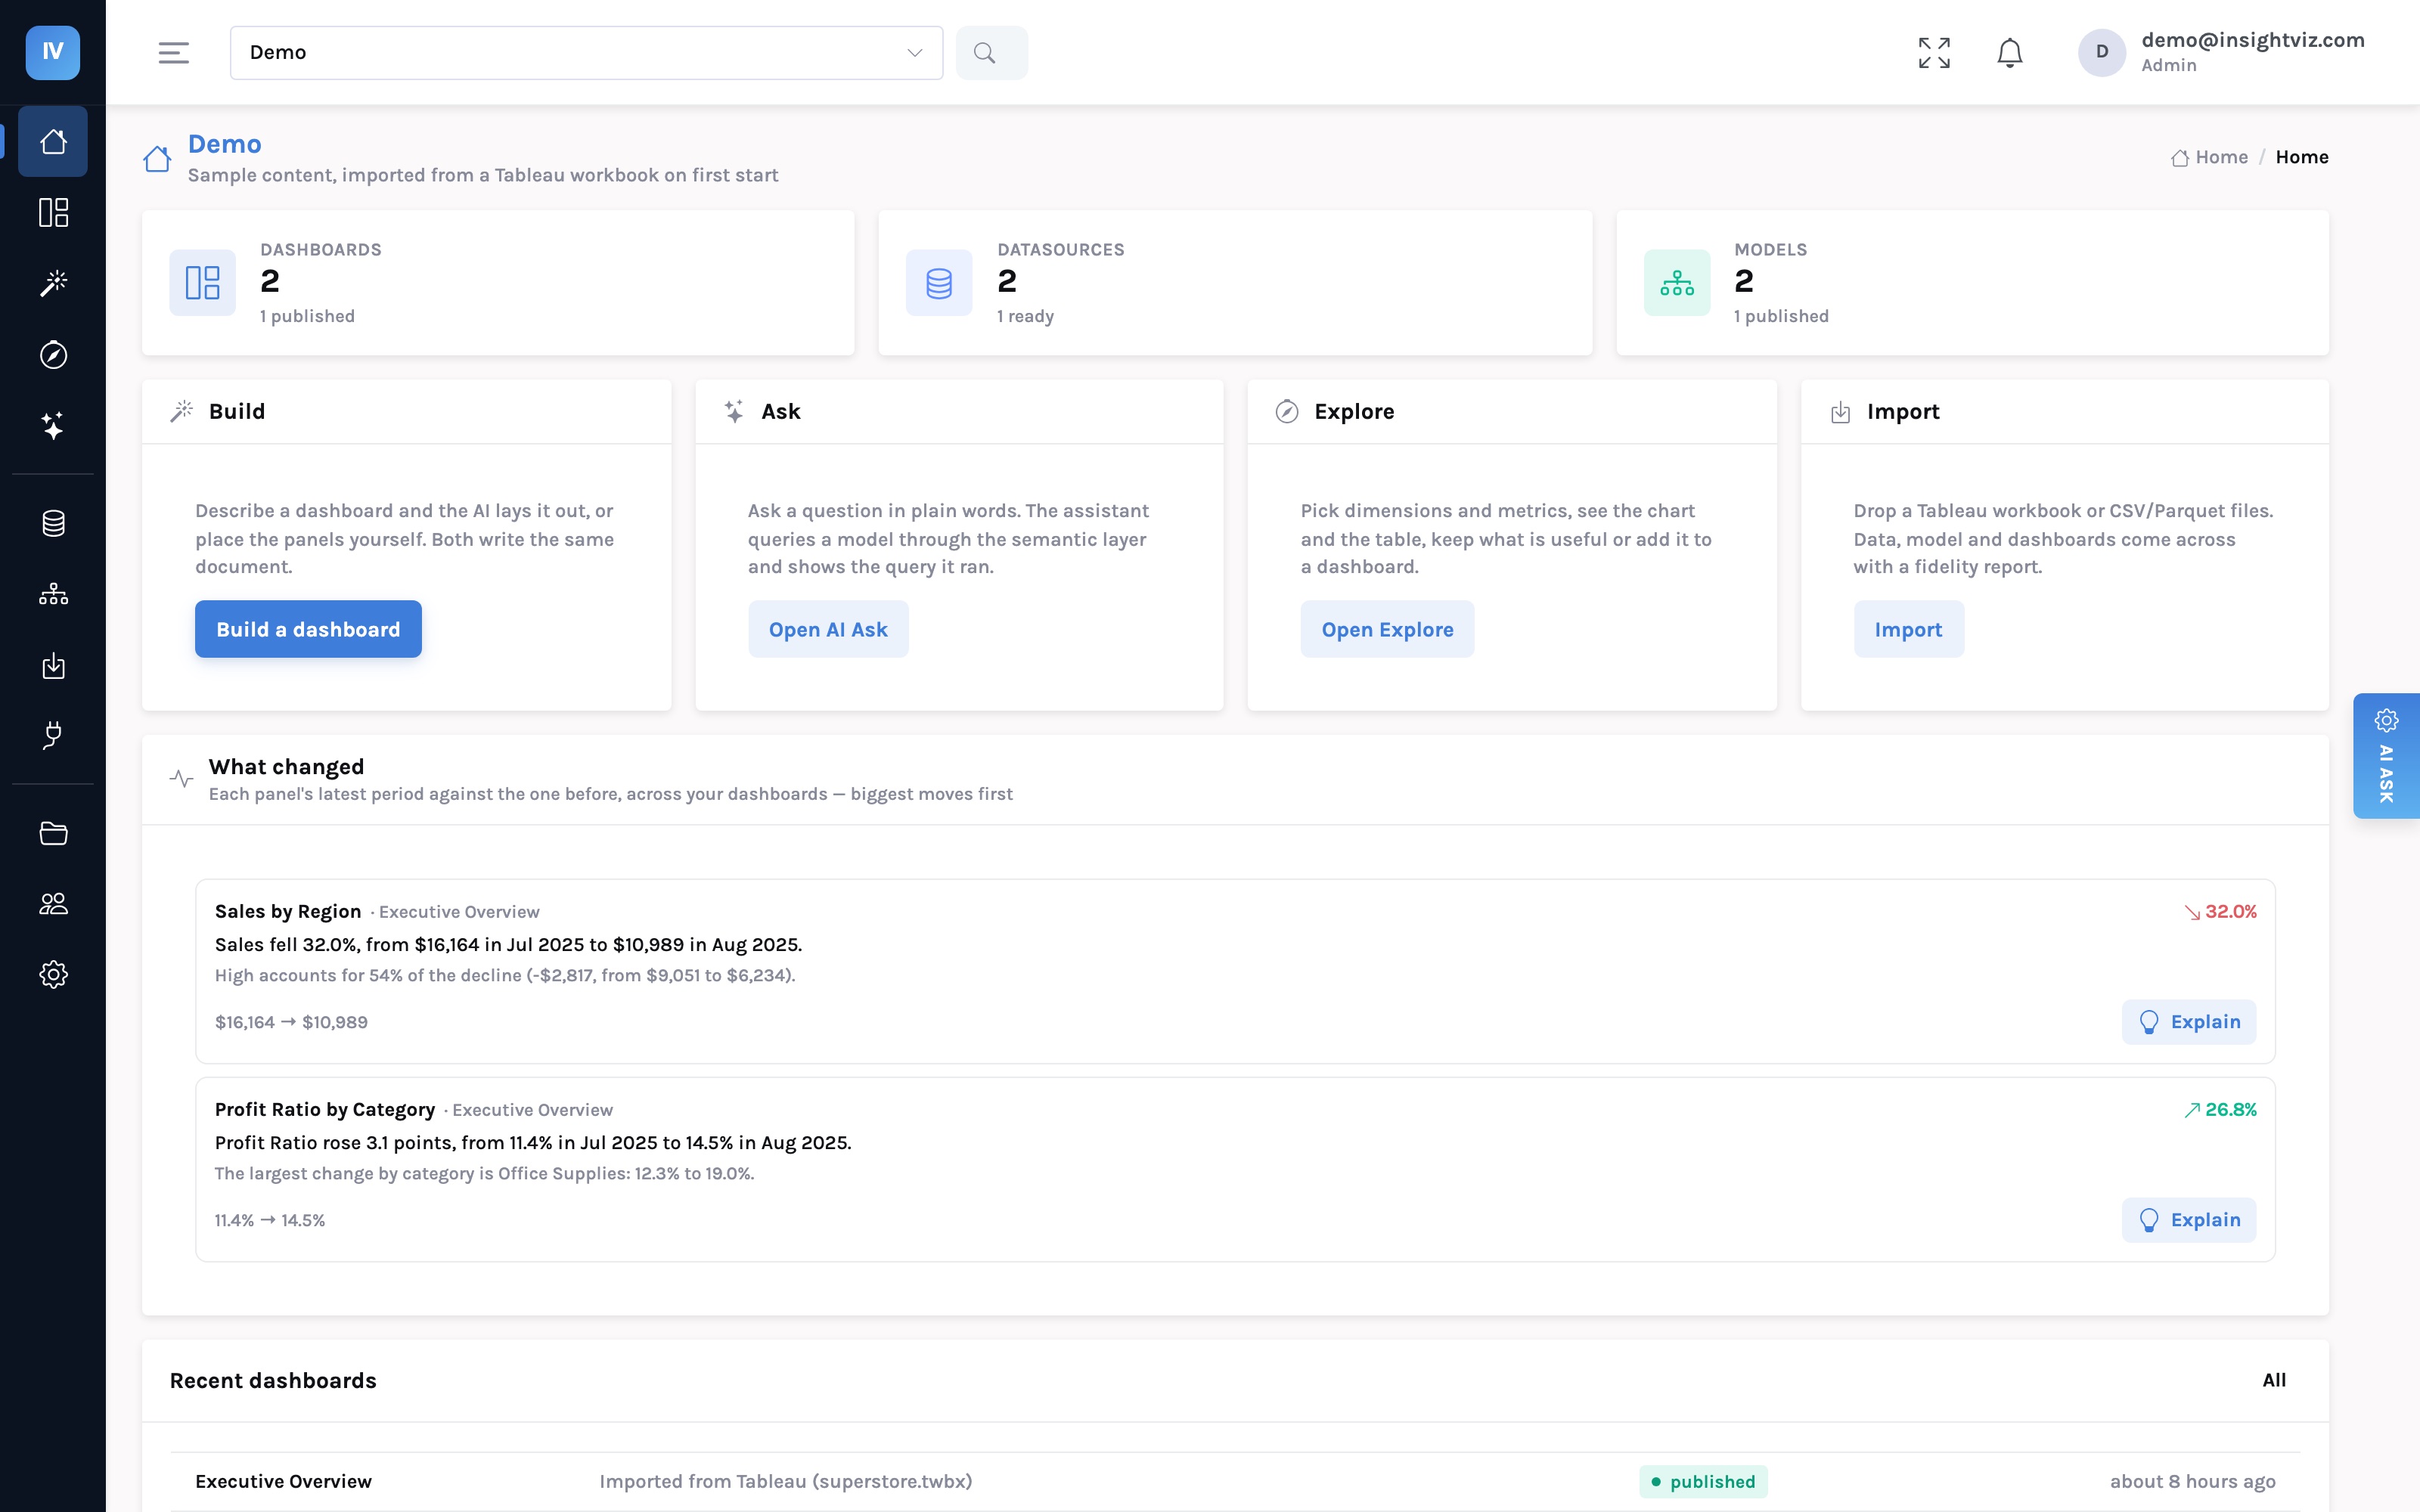
None of it is a model guessing. The periods, the contributions and the sentences are computed from his own rows, under his own access rules — his region, nobody else’s — and a question typed under the panel is answered only from that evidence. What the panel does, step by step →
What this does not solve
- A bad dashboard is still bad. If the page shows the wrong six charts, drilling into them faster does not help. Someone who understands the job still decides what belongs on the page.
- Drill only goes where a hierarchy exists. Region → category → product works because somebody declared it. If nobody has declared product-to-SKU, Marcus stops at product — and the page tells him so rather than guessing.
- The assistant answers what the model can express. “Was that range out of stock?” only works because inventory is in the model. If it is not, that is still a conversation with an analyst — a much rarer one.
- It will not tell him why the sofa range sold eleven units. That is a phone call to nine store managers, and it always was.
The test, on your own estate
Sit with one manager for ten minutes while they use your current dashboard. Do not help them. Count how many of their first seven instincts the tool supports.
Most estates score two. Nobody has measured it, because the people who build dashboards do not read them — and the people who read them assume the friction is their own fault.
What changes when anyone can ask → · Why this group dominates the bill →