Ask a BI lead how many dashboards they have and you get a number. Ask how many were opened last quarter and you get a pause. The pause is the finding.
The measurement takes an afternoon, works on the tool you already have, and routinely turns out to be the largest single input to a migration plan — larger than the licence analysis, larger than the fidelity report.
Eighty-eight dashboards had never been opened by anyone including their author. The migration had been scoped, and budgeted, against 512.
Three other things fell out of the same query. Forty-one of the dormant dashboards were still driving scheduled extract refreshes, which were still querying the warehouse nightly. Twenty-two seats belonged to people whose only dashboards were in the dormant set. And the three teams who had each built their own revenue definition had done so because a search for “revenue” returned 140 results.
sankey-beta
512 dashboards,Opened by 3 or more,98
512 dashboards,Opened by 1 or 2,49
512 dashboards,Not opened in 90 days,277
512 dashboards,Never opened at all,88
How an estate gets this way
Not carelessness. Four mechanisms, each individually reasonable, compounding over a decade.
| Mechanism | What happens | Why nobody stops it |
|---|---|---|
| Duplication is the fast path | A team needs a variant of an existing dashboard. Copying takes a minute; asking the owner to parameterise it takes a week. | The copy is the correct decision for that team on that day. |
| One-off requests become permanent | “Can I get this for the board meeting?” produces a dashboard. The board meeting happens once. | Deleting it afterwards is nobody’s task. |
| Reorganisations orphan things | The team dissolves; the dashboards stay, owned by a distribution list that no longer resolves. | Nobody knows whether anyone still depends on them. |
| Deleting has downside and no upside | If you delete something someone needed, that is your fault. If you keep something nobody needs, that is free. | The incentives point one way only |
Every BI estate is a ratchet. Things can be added by anyone in a minute and removed by nobody without a meeting.
Take the measurement
Three numbers, from usage logs you already have. Ninety days is the right window — long enough to catch quarterly reporting, short enough that “someone might need it” stops being an argument.
| Count | Query | What it means |
|---|---|---|
| Dashboards owned | Everything in the estate, excluding personal drafts. | The number people quote |
| Opened at least once in 90 days | Distinct dashboards with one or more views. | The real estate |
| Opened by more than three people | Distinct dashboards with three or more distinct viewers. | The estate that matters |
pie showData
    title A typical estate, by views in 90 days
    "Never opened" : 62
    "Opened by one or two people" : 23
    "Genuinely shared" : 15
The middle slice deserves attention because it is where the argument happens. A dashboard one person opens weekly is not shelfware to that person. It is also not a shared asset, and it should probably be a saved exploration rather than a maintained page.
The number changes the migration scope, not just the tidying
Most BI migrations are scoped from the file list, which means budgeting to rebuild and reconcile several hundred dashboards that nobody would notice the absence of. This is the single largest cost overrun available in a BI programme, and it is entirely avoidable by running one query first.
What it costs to keep them
The instinct is that an unopened dashboard costs nothing. It costs four things, none of which appear on an invoice.
- Search noise. The reason the third team built their own was that they could not find the first two among four hundred results.
- Metric drift. Every unopened dashboard contains a definition. Those definitions are in circulation whether or not anyone looks at them, and they surface when someone finds one and trusts it. How that compounds →
- Refresh load. Extracts feeding dashboards nobody opens still refresh, still query the warehouse, still cost money on a schedule.
- Licences. Seats are often allocated to the owners of unopened dashboards, and renewals are negotiated on headcount that includes them.
Retire before you migrate
Retiring is faster than migrating, and it improves the estate more. The sequence that works, and the one order that matters:
Everything is rebuilt and reconciled, then someone is supposed to clean up afterwards. They never do, because by then the dashboards exist in the new tool and deleting them has the same downside it always had.
Measure first. Archive what nobody opened. Migrate what remains, which is usually a third of what you thought, and reconcile it properly because you have the time.
- Archive, do not delete. Move unopened dashboards somewhere they are still recoverable and stop maintaining them. The distinction matters politically and costs nothing technically.
- Announce it with the list and a date. “These 287 were not opened in ninety days and will be archived on the 30th.” You will get a handful of objections, and each one is useful information.
- Keep the objections. A dashboard someone rescues is a dashboard with a confirmed owner, which is more than most of the estate has.
- Migrate what is left. Now the fidelity report is about content people actually use, and the review list is short enough to work through.
Twenty-two objections out of 365, and every one produced something useful: sixteen dashboards that now have an owner, and two embedded surfaces nobody had documented. The two embedded ones are the reason to announce rather than simply archive.
Why the new estate stays smaller
Retiring once does nothing if the ratchet still works. Two properties change the equilibrium, and neither is a policy:
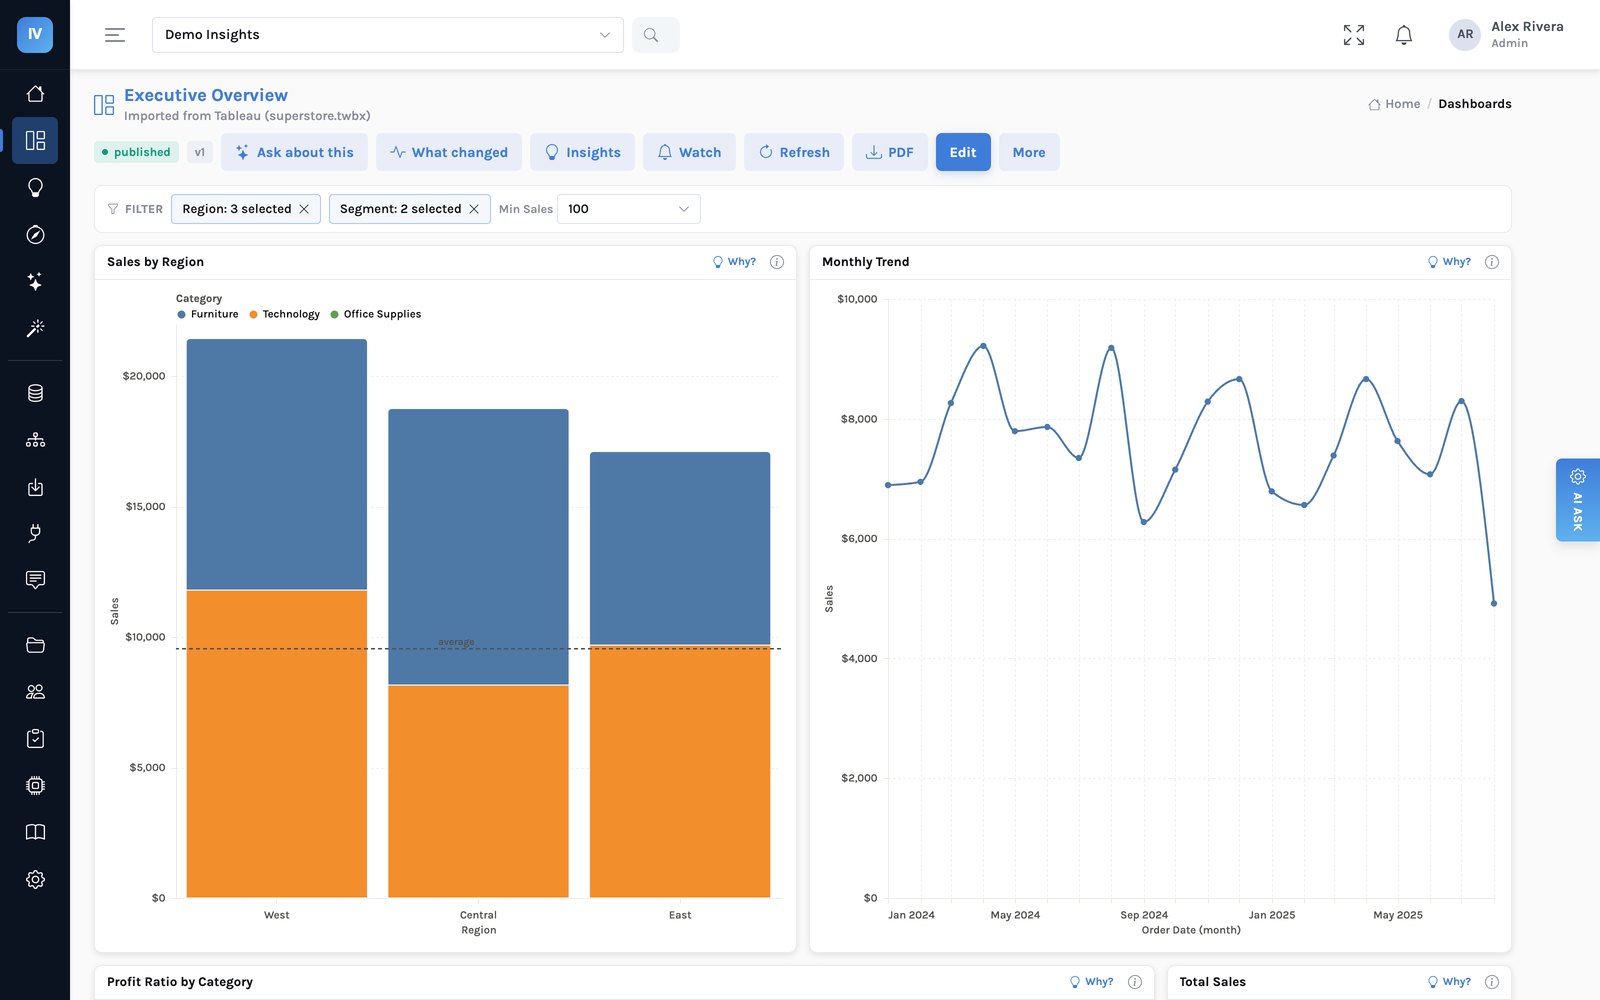
- A question does not have to become a dashboard. Most one-off requests exist as pages because asking was not possible. When someone can ask in plain words and keep the answer only if it turns out to matter, the marginal dashboard stops being created. What changes when anyone can ask →
- A variant does not have to be a copy. Filters, cross-filtering and drill mean the “same chart but by segment” request is a click rather than a duplicate.
Two honest caveats
- Usage logs undercount embedded views. If dashboards are surfaced inside another application, check that path separately before archiving anything. This is the one way to get the measurement badly wrong.
- Annual dashboards exist. A ninety-day window misses genuine yearly reporting. Run a twelve-month count alongside and treat the difference as the “check with a human” list rather than as noise.
The one paragraph to act on
Before you scope a migration, before you negotiate a renewal, before you evaluate anything: count the dashboards nobody opened in ninety days. If it is more than half — and it will be — every other number in your business case is being calculated against the wrong denominator.
The other numbers worth taking a baseline on → · Where this sits in the sequence →